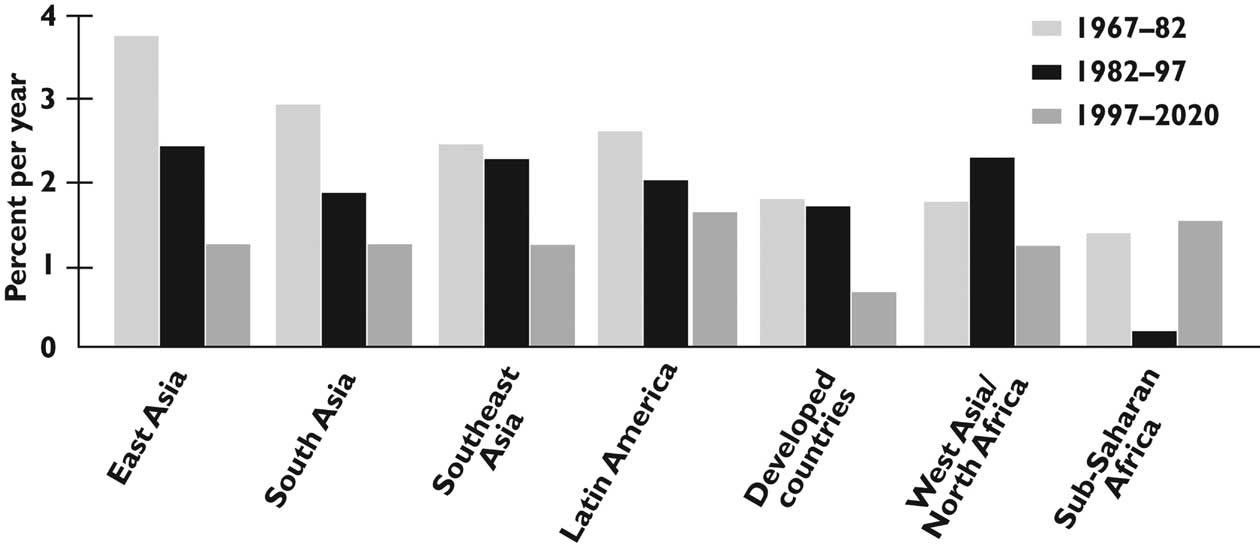
Figure 4-4. Cereal yield growth rates by region, 1967-2020. Source: Rosegrant et al., 2001 based on
IFPRI IMPACT projections and FAOSTAT.
| Previous | Return to table of contents | Search Reports | Next |
| « Back to weltagrarbericht.de | ||
Food Systems and Agricultural Products and Services towards 2050 | 91
Figure 4-4. Cereal yield growth rates by region, 1967-2020. Source: Rosegrant et al., 2001 based on
IFPRI IMPACT projections and FAOSTAT.
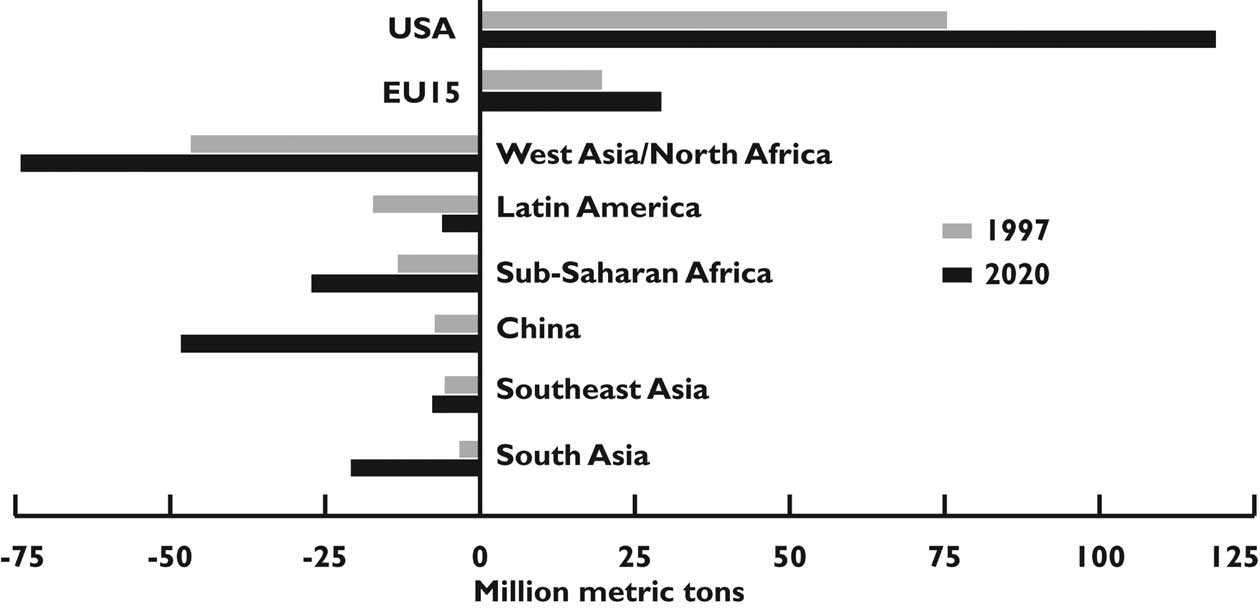
Figure 4-5. Net trade in cereals by region, 1997 and 2020. Source: Rosegrant et al., 2001 based on IFPRI
IMPACT projections.
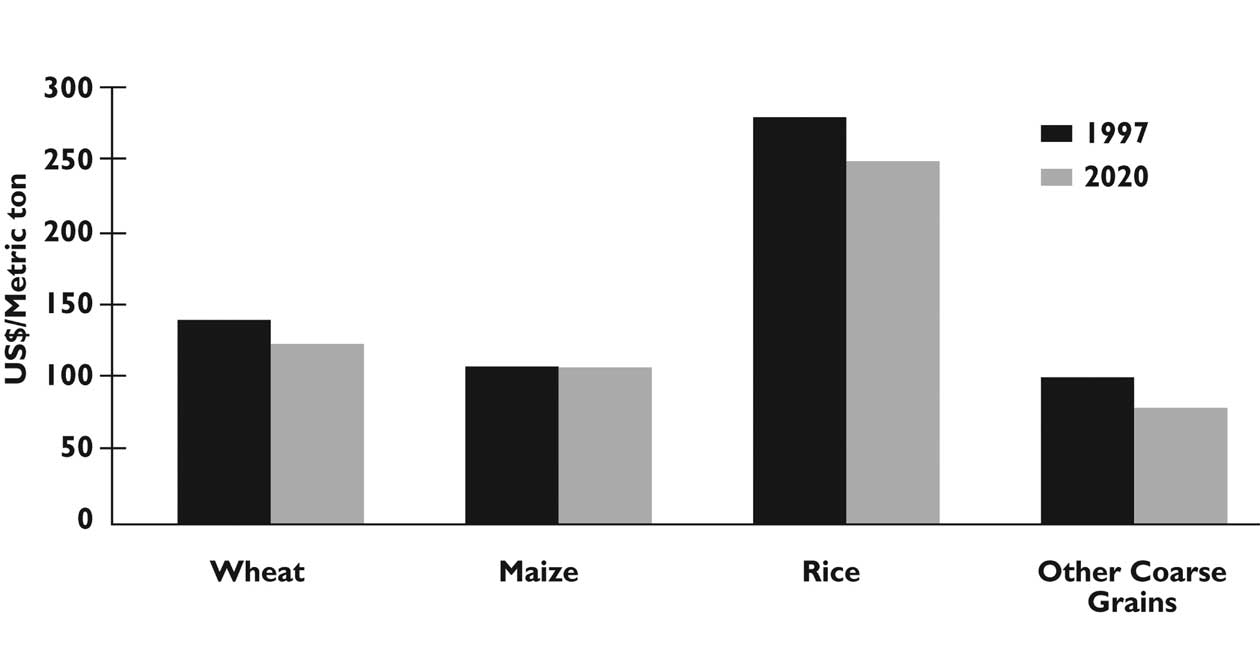
Figure 4-6. Cereal prices by crop, 1997 and 2020. Source: Rosegrant et al., 2001 based on
IFPRI IMPACT projections.
| Previous | Return to table of contents | Search Reports | Next |
| « Back to weltagrarbericht.de | ||