| Previous | Return to table of contents | Search Reports | Next |
| « Back to weltagrarbericht.de | ||
92 | Sub-Saharan Africa (SSA) Report
Table 4-3. Use of roots and tubers in 1993 and projected to 2020, baseline scenario.
Region |
Cassava |
Potato |
Sweet potato and yam |
All roots and tubers |
||||
(million tonnes) |
||||||||
1993 |
2020 |
1993 |
2020 |
1993 |
2020 |
1993 |
2020 |
|
Sub-Saharan Africa |
87.7 |
168.1 |
2.8 |
6.3 |
36.0 |
74.5 |
126.4 |
248.9 |
Developing countries |
152.0 |
254.6 |
95.2 |
163.2 |
155.5 |
217.3 |
402.7 |
635.1 |
Developed countries |
20.7 |
20.5 |
190.1 |
206.2 |
2.5 |
2.7 |
213.3 |
229.4 |
World |
172.7 |
275.1 |
285.3 |
369.4 |
158.0 |
220.0 |
616.0 |
864.5 |
Source: IMPACT Simulations; Scott et al., 2000.
Table 4-4. Projected annual growth rates for roots and tubers, 1993-2020, baseline scenario.
Region |
Cassava |
Potato |
Sweet potato and yam |
All roots and tubers |
||||||||
Food |
Feed |
Fiber |
Food |
Feed |
Fiber |
Food |
Feed |
Fiber |
Food |
Feed |
Fiber |
|
(% per year) |
||||||||||||
Sub-Saharan Africa |
2.49 |
1.53 |
2.44 |
3.10 |
1.81 |
3.10 |
2.74 |
1.89 |
2.73 |
2.55 |
1.56 |
2.54 |
Developing countries |
1.99 |
1.62 |
1.93 |
2.33 |
0.37 |
2.02 |
0.44 |
1.81 |
1.25 |
1.62 |
1.57 |
1.70 |
Developed countries |
-0.50 |
0.01 |
-0.04 |
0.37 |
0.22 |
0.30 |
0.28 |
0.61 |
0.33 |
0.36 |
0.15 |
0.27 |
World |
1.98 |
0.95 |
1.74 |
1.20 |
0.26 |
0.96 |
0.43 |
1.80 |
1.23 |
1.30 |
1.07 |
1.26 |
Source: IMPACT Simulations; Scott et al., 2000.
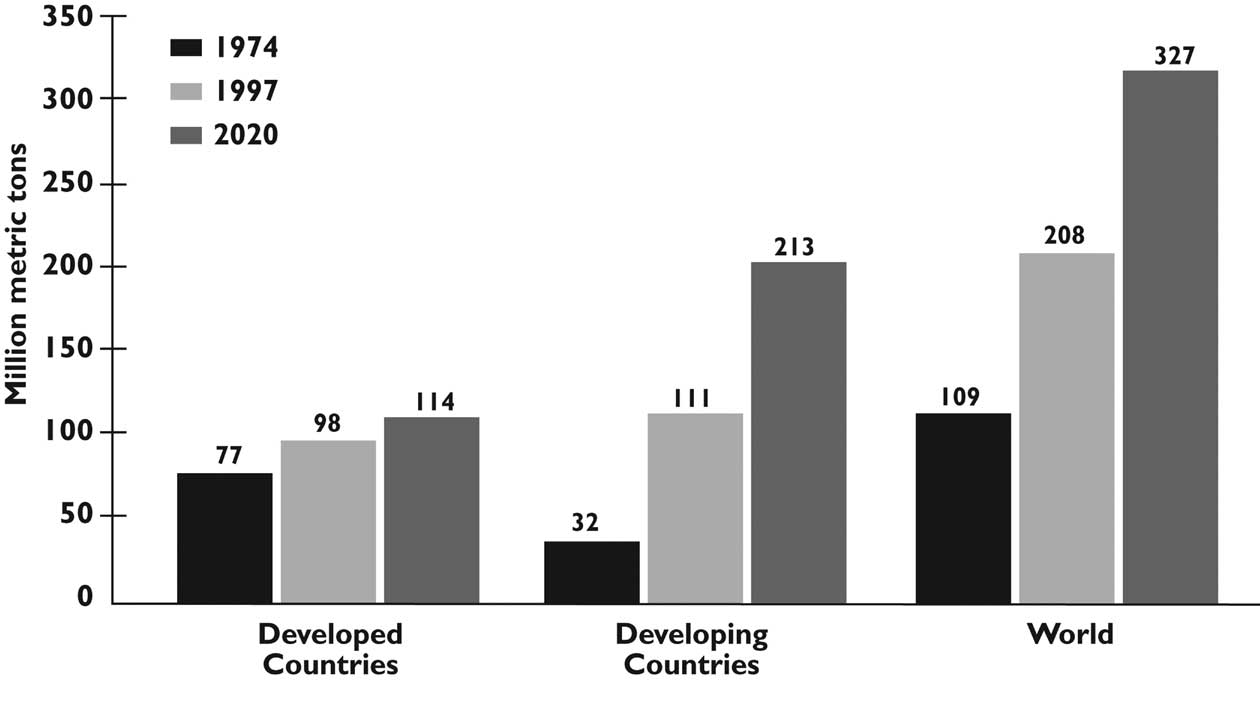
Figure 4-7. World demand for meat, 1974, 1997, and 2020. Source: Rosegrant et al., 2001 based on IFPRI IMPACT
projections.
| Previous | Return to table of contents | Search Reports | Next |
| « Back to weltagrarbericht.de | ||