| Previous | Return to table of contents | Search Reports | Next |
| « Back to weltagrarbericht.de | ||
Looking Into the Future for Agriculture and AKST | 331
|
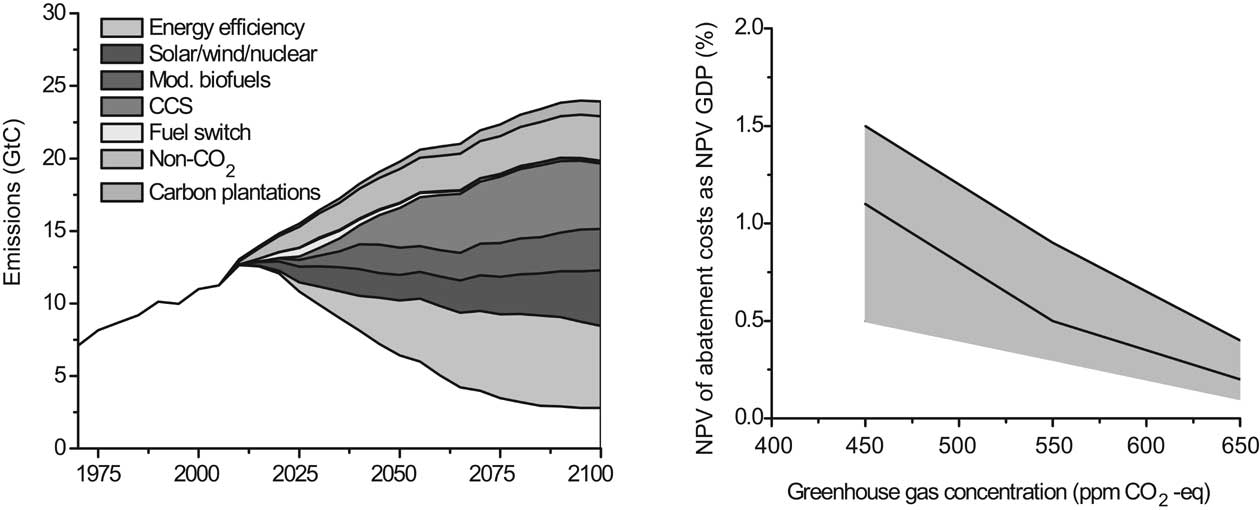
Figure 5-22. Contribution of various options in reducing greenhouse gas emissions from baseline to the 450 ppm CO -eq variant and the costs associated with stabilizing greenhouse gas concentrations. Source: IMAGE-model; Van Vuuren, 2007
Note: Net present value of abatement costs at 5%; discount rate as percentage of GDP
climate system, but also due to the fact that climate policy also reduces SO2 emissions, reducing atmospheric aerosols that lead to a net cooling. In other words, impacts on agriculture in 2050 are similar in the stringent policy case as in the reference run (see 5.3.3.4). Uncertainty does not come from different variants—but differences in climate sensitivity. In the longer run, however, the temperature of the policy case will remain significantly below the reference case. 5.4.2 Trade policies and international market constraints Support policies and border protection of wealthy OECD countries, valued at hundreds of billions of dollars each year, cause harm to agriculture in developing countries. Evaluating the overall effects of subsidies and trade protec- |
|
tion policies of industrialized countries on developing countries and poverty within developing countries is challenging. The evaluation must rest on counterfactual simulation of alternative policy variants leading to a diverse set of policies and application of a range of different models. As part of this report, GTEM was applied to two hypothetical variants representing two alternative global trade policy regimes. Variant 1 represents a global economy in which import tariffs (and tariff equivalents) on all goods are removed incrementally between 2010 and 2020 across the globe. Variant 2, on the contrary, represents a world in which trade barriers will escalate gradually between 2010 and 2020 such that by 2020 these barriers will be equivalent to twice the size of the existing tariff (and tariff equivalent) barriers across the board. |
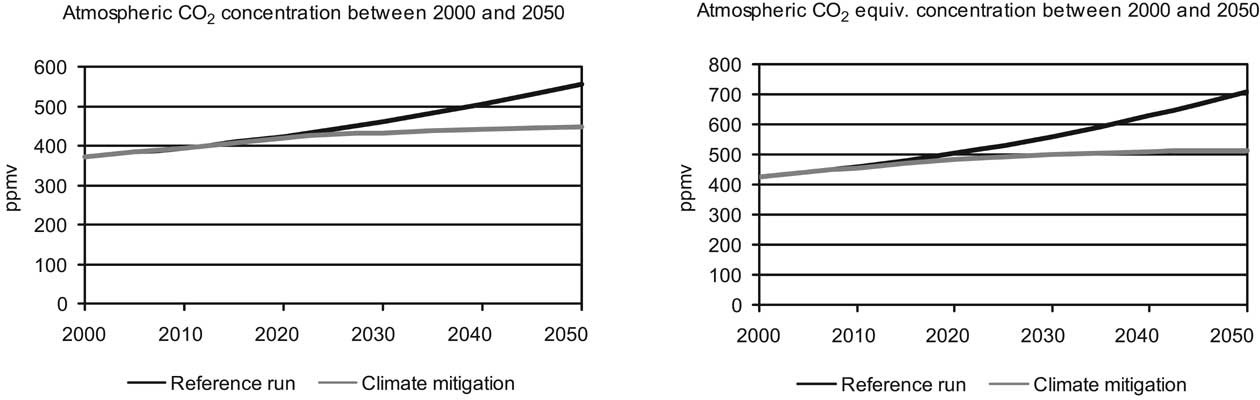
Figure 5-23. Atmospheric CO2 and CO2-eq concentration between 2000 and 2050. Source: IMAGE-model
| Previous | Return to table of contents | Search Reports | Next |
| « Back to weltagrarbericht.de | ||