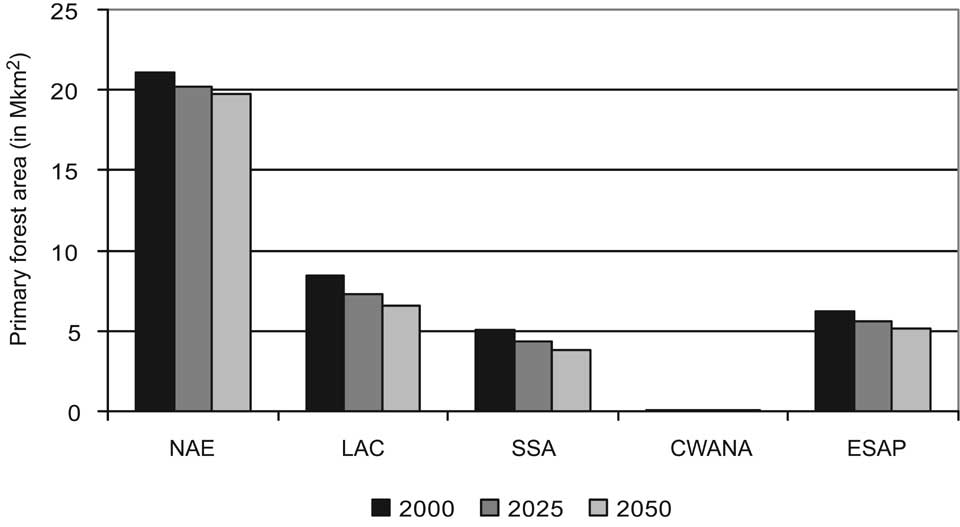
Figure 5-19. Change in forest areas excluding regrowth, 2000, 2025, and 2050. Source: IMAGE model.
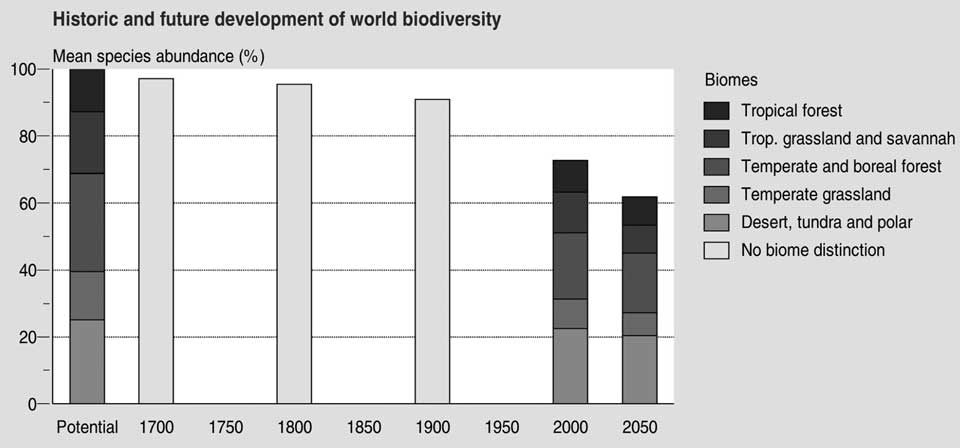
Figure 5-20. Development of global biodiversity 1700-2050 in mean species abundance in various natural biomes. Source: GLOBIO 3.
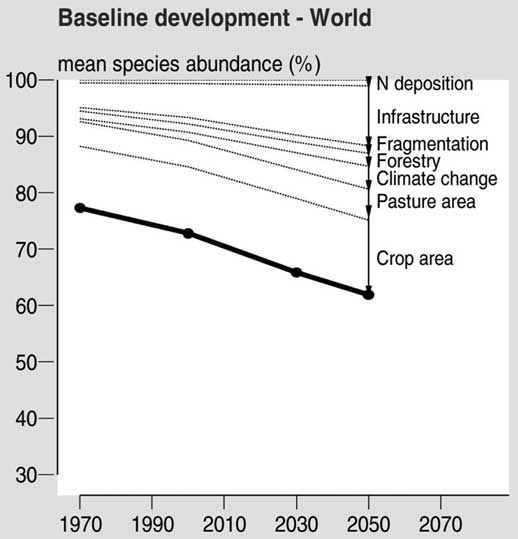
Figure 5-21. Biodiversity development for the world, and contribution of stress factors to the decline in the reference run. Source: GLOBIO 3.
5.4 Assessment of Selected, Major Policy Issues
5.4.1 Climate change policies and agriculture
In the previous subchapters, we have shown that the reference projection leads to a strong increase in greenhouse gas concentration—and thus considerable climate change. In contrast, the recent IPCC reports indicate that avoiding dangerous anthropogenic interference with the climate system may require stabilization of GHG concentration at relatively low levels. Current studies on emission pathways, for instance, indicate that in order to achieve the objective of EU climate policy (limiting climate change to 2°C compared to pre-industrial) with a probability of at least 50% may require stabilization below 450 ppm CO2-eq. Stabilization at 450, 550 and 650 ppm CO2-eq, is likely to lead to a temperature increase of respectively, about 1.2-3°C, 1.5-4°C, and 2-5°C. The Stern review recently concluded that given all evidence, limiting temperature increase to about 2°C would be an economically attractive goal (Stern, 2006). This conclusion has been debated by some authors, but also found strong support by others. For the purpose of this report, we have decided to explore the impact of stringent climate policies.
The IPCC AR4 WGIII report concludes on the basis of model-supported scenario analysis that several model studies show that it is technically possible to stabilize greenhouse gas emissions at 450 ppm CO2-eq. after a temporary overshoot. This is also supported by the model analysis carried out for IAASTD. Emission reductions required to stabilize at 450 ppm (around 60% in 2050 and 90% in 2100, globally) can be reached through various emission reduction options (Figure 5-22). Efficiency plays an important role in the overall portfolio. Carbon capture and storage is another important technology under default assumptions—but may be substituted at limited additional costs against other zero-carbon emitting technologies in the power sector. Obviously, the concentration target forms a tradeoff between costs and climate benefits. The net present value of abatement costs (2010-2100) for the B2 baseline scenario (a medium scenario) increases from 0.2% of cumulative GDP to 1.1%, going from stabilization at 650 to 450 ppm. On the other hand, the probability of meeting the EU climate target (limiting global mean temperature increase to 2°C) increases from 0-10% to 20-70%.
One important option in the overall portfolio is also bioenergy. As discussed in Chapter 4, there is a strong debate on the advantages and disadvantages of bioenergy. The 450 ppm stabilization case is likely to lead to a strong increase in land use for bioenergy. A recent paper by van Vuuren et al. (2007) on the basis of a comparable scenario found land for bioenergy to increase from 0.4 to 1.0 Gha in 2100, while at the same time land for carbon plantation increased from 0 to 0.3 Gha.
Obviously, the climate policy variant has important benefits in reducing climate change, although some of these may only materialize in the long-term (Figure 5-23). As shown, the emission reductions are likely to reduce greenhouse gas concentration substantially in 2050. At the same time, however, the medium-term (2050) impacts on temperature increase are relatively slow. The latter is due to inertia in the