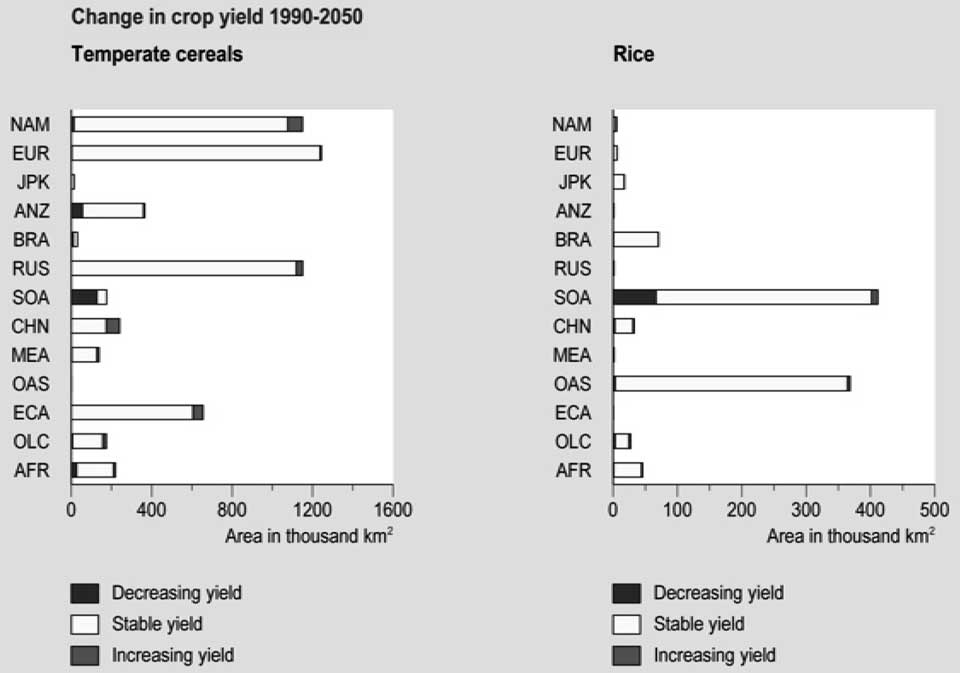
Figure 5-15. Change in potential crop yield (1990-2050) attributed to climate change. Source: IMAGE model.
Note: Regions are North America (NAM), Europe (EUR), Japan and Korea (JPK), Oceania (ANZ), Brazil (BRA), Russia (RUS), South Asia (mainly India; SOA), China (CHN), Middle East (MEA), Other Asia (OAS), Eastern Europe and Central Asia (ECA), Other Latin America (OLC) and Africa (AFR).
1970 are excluded from the areas shown in Figure 5-19. The only new areas included are those that change from other natural biomes to forest as a consequence of climate change and without human intervention. The figure illustrates that natural forest areas decline in all regions, but most clearly in developing regions like LAC and ESAP.
Biodiversity is expressed in terms of the indicator mean species abundance (see Appendix on GloBio3). The MSA value is affected by a range of human induced stress factors. For terrestrial biodiversity these include loss of habitat, climate change, excess nitrogen deposition, infrastructure and fragmentation. These stress factors are the direct drivers of biodiversity loss and are derived from indirect drivers such as population, GDP and energy use.
Loss of the biodiversity quality in the natural biomes started already many centuries ago, as can be seen in the his-
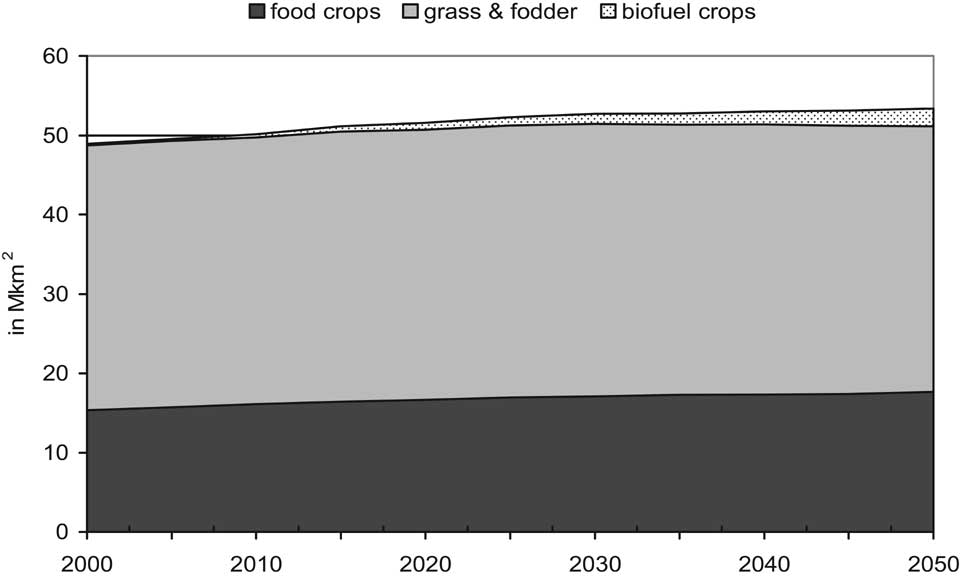
Figure 5-1 6. Agricultural area (food crops, pastureland and biofuel crops) globally, 2000 to 2050, reference run. Source: IMAGE model.
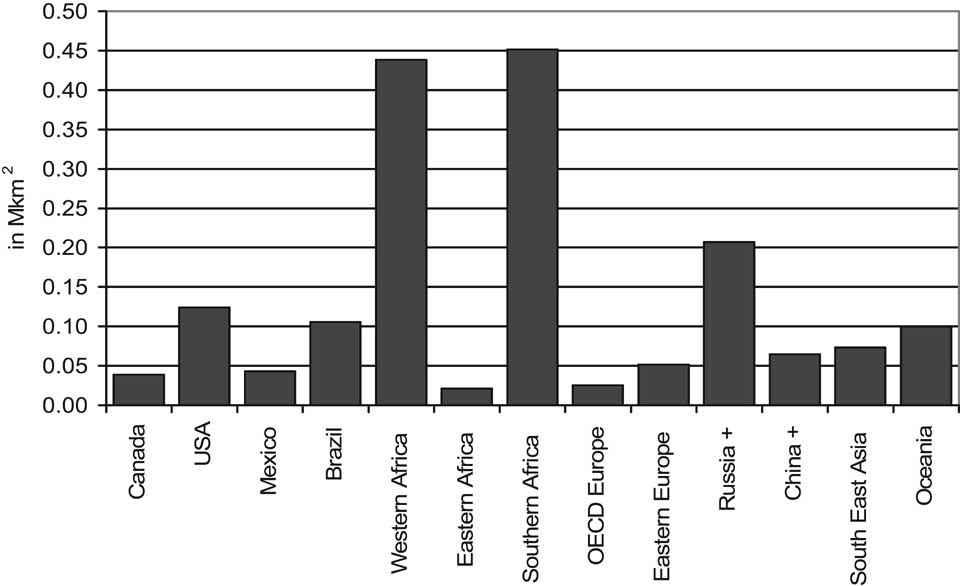
Figure 5-1 7. Bioenergy area in 2050 for different countries and regions in the world, reference run. Source: IMAGE model.
torical graph from 1700 to 2000 (Figure 5-20). The strongest declines occur in the temperate and tropical grasslands and forests. The remaining biodiversity is found more and more in biomes that are less suitable for human development and thus less likely to be affected, such as deserts and polar biomes. This trend continues with an anticipated and accelerating further loss of biodiversity.
At the global level, there is a substantial biodiversity loss in the reference run: the remaining MSA level drops another 10% after 2000. The rate of decrease for the period 2000-2050 is even higher than in the period 1970 to 2000 (Figure 5-21). The role of agricultural land-use change remains the largest of all pressure factors, which is clearly related to the strong increase in crop areas (see 5.3.3.5). The major contributors to the additional biodiversity loss from 2000 to 2050 are: expanding infrastructure, agriculture and climate change. The influence of nitrogen deposition and fragmentation does not increase, even though these factors share similar indirect drivers as the other factors. In fact, through expanding agriculture, less natural biomes are left where these stresses can exert their influence.
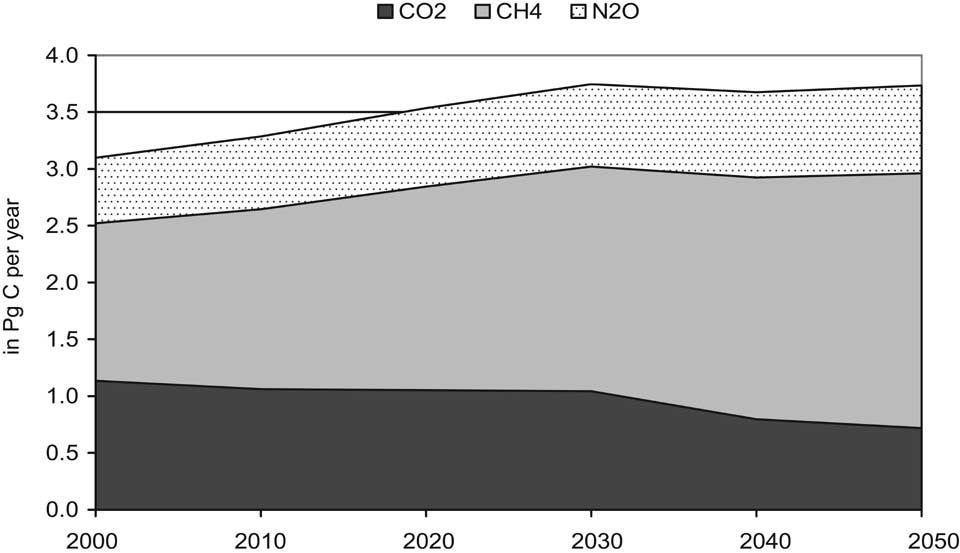
Figure 5-18. Land-use emissions from CO2, CH4 and N2O from 2000 to 2050, reference run. Source: IMAGE model.