The key impacts of the two alternative variants at 2025 are analyzed below. Unless otherwise stated, the impacts are expressed as deviations from the reference case which represents no trade liberalization or reduced sectoral protection throughout the projection period. It should be noted that the impacts of trade policy changes only represent static gains/losses associated with resource reallocation and do not encapsulate any potential dynamic gains/losses associated with any long-run productivity changes. Furthermore, except for the trade policies in question, all other policies remain unchanged as in the reference case.
Figure 5-24 shows the overall impacts of trade liberalization under variant 1 in terms of changes in gross regional product (a regional equivalent to GDP). The world economy is projected to benefit from multilateral trade liberalization. In particular, gross regional products in CWANA and SSA regions are projected to grow the most, by more than 2% relative to the reference case at 2025. However, about two-fifths of the global benefits (in today's dollars) are projected to accrue to the ESAP region. Interestingly, while the removal of trade barriers under variant 1 is projected to increase income and food consumption, the global structure of food production appears to undergo significant changes. Compared with the reference case, a significant increase in meat production is projected to occur in LAC and SSA regions with a substantial decline projected for the NAE region (Figure 5-25). The structural change in global production of nonmeat food is not as striking as in the case of meat. In nonmeat production, LAC and SSA regions are projected to register the most growth relative to the reference case at 2025 (Figure 5-26).
There is an increase globally in overall trade volume under liberalization, with a noticeably larger effect, relative to the reference case, in 2025 (soon after the liberalization is complete), compared with 2050 (Figure 5-27). Figure 5-28 presents changes in cereal production as a result of the trade liberalization variant. The removal of protection for important cereals in North Africa leads to a decline in production in the CWANA region, as well as in the NAE region. On the other hand, production in ESAP, SSA, and LAC increases. Trade liberalization leads to increased prices for cereals and meats in 2025 (Figure 5-29), but prices decline again somewhat in the later period.
While estimates of the benefits of removal of global agricultural subsidies and trade restrictions vary, other analyses have found similarly positive outcomes for Africa. One study finds that under full global agricultural trade liberalization (complete removal of trade barriers), Africa would receive annual net economic benefits of US$5.4 billion (Rosegrant et al., 2005). Another study indicated that European Union agricultural policies have reduced Africa's total potential agricultural exports by half. Without these agricultural policies, the current US$10.9 billion food-related exports annually from SSA could actually grow to nearly US$22 billion (Asideu, 2004).
Under variant 2 in which trade protection will be doubled between 2010 and 2020, all broad regional economies are projected to decline relative to the reference case (Figure 5-30). Again, CWANA and SSA regions are projected to be affected the most, declining by about 1.5% relative to the reference case at 2025.
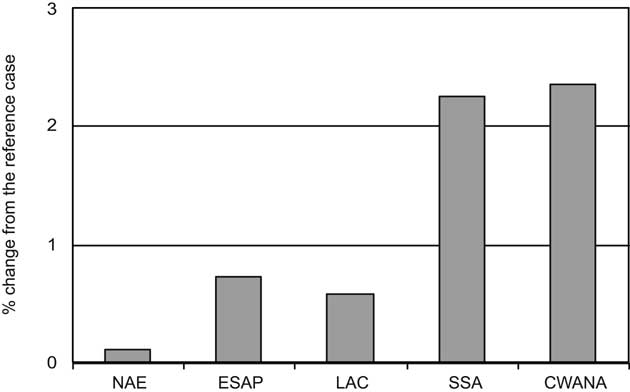
Figure 5-24. Projected impacts on gross regional product of trade liberalisation under variant 1 at 2025. Source: GTEM.
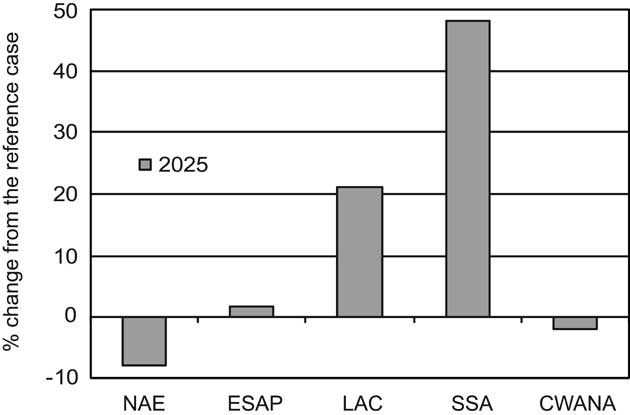
Figure 5-25. Projected impacts on meat production under variant 1 at 2025. Source: GTEM.
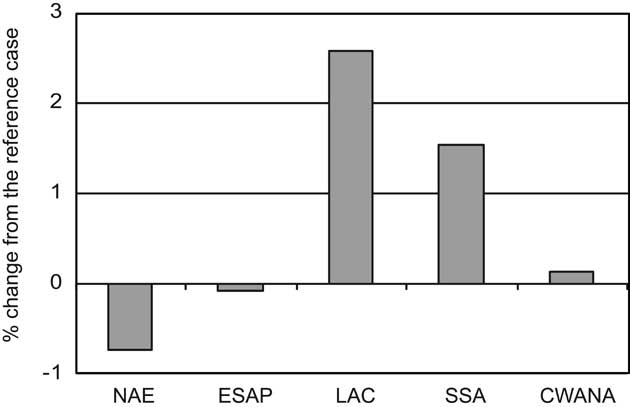
Figure 5-26. Projected impacts on nonmeat food production under variant 1 at 2025. Source: GTEM.