region, average crop yield growth will decline to 1.02% per year; in CWANA to 1.26% per year, and in ESAP to 0.84% annually, while cereal yield is expected to grow at a higher 1.61% and 1.68% per year in LAC and SSA, respectively.
Area expansion is significant to projected food production growth only in sub-Saharan Africa (28%) and in the LAC region (21%) in the reference run (Figure 5-5).
Table 5-9 presents regional estimates of grazing intensity in the reference world. These were calculated as the number of Tropical Livestock Units (TLU) (bovines, sheep and goats, where one bovine is equivalent to one TLU and a sheep and goat to 0.1 TLU) in the rangeland system per hectare of rangeland system occurring in each FPU. These figures were again aggregated to the five IAASTD regions. Ruminant grazing intensity in the rangelands increases in all regions in the reference run, but there are considerable regional variations. In LAC, for instance, average grazing intensities are expected to increase by about 70%, from 0.19 in 2000 to 0.32 TLU per ha for the reference run. Most of these increases will be due to higher inputs in the grazing systems in the humid and subhumid savannas. The increases are less in CWANA and SSA, and for the latter, grazing intensities are fairly stable after 2030—cattle numbers have peaked by 2040 and there are fewer in 2050 than in 2030 (see Table 5-5), small ruminant numbers by 2050 are only somewhat above those for 2030, while at the same time the model indicates some loss of grazing land in SSA to necessarily marginal mixed rainfed systems. Grazing intensities change relatively little in NAE. Again, given typical stocking rates of 10-15 ha per animal in the arid and semiarid grazing systems, these results of the reference run imply considerable intensification of livestock production in the humid and subhumid grazing systems of the world, but particularly in LAC.
It should be noted that the rate of conversion of range-land to mixed systems will be underestimated in this analysis. The impact of infrastructural development is not taken into account, so the projected changes in grazing intensities are likely to be underestimated as a result. The analysis also makes implicit assumptions about the relative share of production that is projected to come from the rangeland versus the mixed systems in the future, in terms of relative animal numbers. Even so, given the fragility of semiarid and arid rangelands, particularly in SSA, and the uncertainties con-
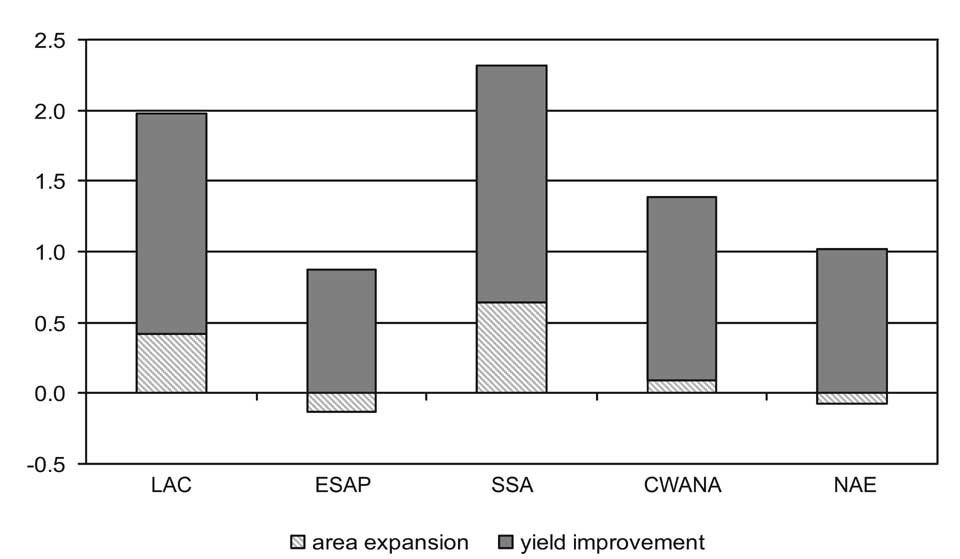
Figure 5-5. Sources of cereal production growth, reference run, 2000-2050 by IAASTD region. Source: IFPRI IMPACT model simulations.
Table 5-6. Sheep and goats for the reference run, by region (billion head).
| Region | 2000 | 2010 | 2020 | 2030 | 2040 | 2050 |
| CWANA | 0.403 | 0.491 | 0.556 | 0.597 | 0.614 | 0.601 |
| ESAP | 0.723 | 0.871 | 1.008 | 1.115 | 1.184 | 1.210 |
| LAC | 0.116 | 0.136 | 0.154 | 0.168 | 0.175 | 0.174 |
| NAE | 0.195 | 0.218 | 0.235 | 0.244 | 0.244 | 0.231 |
| SSA | 0.271 | 0.346 | 0.406 | 0.443 | 0.459 | 0.457 |
| World | 1.707 | 2.061 | 2.359 | 2.566 | 2.677 | 2.673 |
Source: ILRI SLAM model simulations.
Table 5-7. Pigs for the reference run, by region (billion head).
| Region | 2000 | 2010 | 2020 | 2030 | 2040 | 2050 |
| CWANA | <0.001 | <0.001 | <0.001 | <0.001 | <0.001 | <0.001 |
| ESAP | 0.539 | 0.622 | 0.669 | 0.664 | 0.627 | 0.558 |
| LAC | 0.080 | 0.096 | 0.110 | 0.119 | 0.123 | 0.122 |
| NAE | 0.274 | 0.295 | 0.307 | 0.304 | 0.290 | 0.262 |
| SSA | 0.019 | 0.024 | 0.029 | 0.032 | 0.034 | 0.034 |
| World | 0.912 | 1.038 | 1.115 | 1.121 | 1.076 | 0.978 |
Source: ILRI SLAM model simulations.
Table 5-8. Poultry for the reference run, by region (billion head).
| Region | 2000 | 2010 | 2020 | 2030 | 2040 | 2050 |
| CWANA | 1.449 | 1.677 | 1.901 | 2.108 | 2.306 | 2.424 |
| ESAP | 7.478 | 10.112 | 12.979 | 15.712 | 18.168 | 19.687 |
| LAC | 2.286 | 2.893 | 3.531 | 4.151 | 4.762 | 5.245 |
| NAE | 4.180 | 4.677 | 5.180 | 5.542 | 5.780 | 5.750 |
| SSA | 0.784 | 0.991 | 1.170 | 1.306 | 1.407 | 1.445 |
| World | 16.178 | 20.350 | 24.760 | 28.819 | 32.423 | 34.551 |
Source: ILRI SLAM model simulations.
Table 5-9. Grazing intensities in rangeland systems to 2030 and 2050 for the reference run, by region (TLU per ha).
| Region | 2000 | 2030 | 2050 |
| CWANA | 0.052 | 0.077 | 0.083 |
| ESAP | 0.044 | 0.067 | 0.067 |
| LAC | 0.188 | 0.293 | 0.318 |
| NAE | 0.052 | 0.063 | 0.060 |
| SSA | 0.062 | 0.090 | 0.090 |
| World | 0.064 | 0.094 | 0.098 |
Source: ILRI SLAM model simulations.