| Previous | Return to table of contents | Search Reports | Next |
| « Back to weltagrarbericht.de | ||
276 | IAASTD Global Report
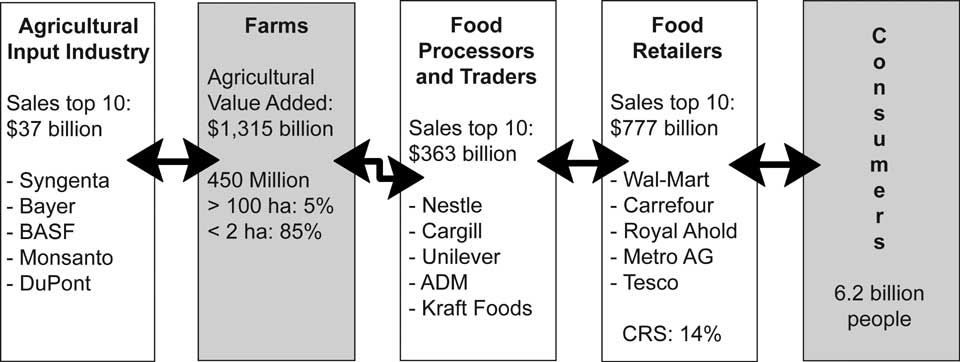
Figure 4-14. Agricultural food business chain. Source: Based on stock market data* and World
Bank, 2005b.
Note: CR5 represents the market share of the top five companies listed in the global retail industry.
* http://www.wsj.com
these studies tend to asymptotically reach maximum availability levels of 3,500-4,000 kcal per capita (Tables 4-10, 4-11; Figures 4-15, 4-16, 4-17). |
|
• In middle-income regions (South East Asia, Central America, South America) food consumption slowly rises towards the level of OECD countries; with little differentiation across the scenarios. |
Table 4-9. Incorporation of changing food demand patterns in global assessment studies.
No. |
Assessment Title |
Publication Date |
Projections timeframe |
Food demand mentioned |
Projections follow/adapted from |
1 |
GEO-3 Assessment |
2002 |
2032 |
|
FAO (2015/2030 outlook) |
2 |
GEO-4 Assessment |
2007 |
2000-2050 |
Explicitly |
IFPRI IMPACT |
3 |
IPCC 3rd Assessment |
2001 |
Various |
Not explicitly |
Various, IPCC-SRES |
4 |
IPCC 4th Assessment |
2007 |
Various |
Not explicitly |
Various, IPCC-SRES |
5 |
Millennium Ecosystem Assessment |
2005 |
2000-2100 |
Explicitly |
IFPRI IMPACT |
|
Comprehensive |
|
|
|
|
6 |
Assessment of Water Management in |
2007 |
2000-2050 |
Explicitly |
Watersim, based on IFPRI IMPACT |
|
Agriculture |
|
|
|
|
7 |
OECD Outlook |
2006 Draft |
2000-2030 |
Not explicitly |
Partly FAO |
8 |
World Energy Outlook |
2006 |
2030 |
Not explicitly |
- |
Sources: UNEP, Global Environmental Outlook, 2002; IPCC, 2001, 2007; MA, 2005; de Fraiture et al., 2007; OECD, 2006; IEA, 2006.
| Previous | Return to table of contents | Search Reports | Next |
| « Back to weltagrarbericht.de | ||