| Previous | Return to table of contents | Search Reports | Next |
| « Back to weltagrarbericht.de | ||
Changes in Agriculture and Food Production in NAE Since 1945 | 23
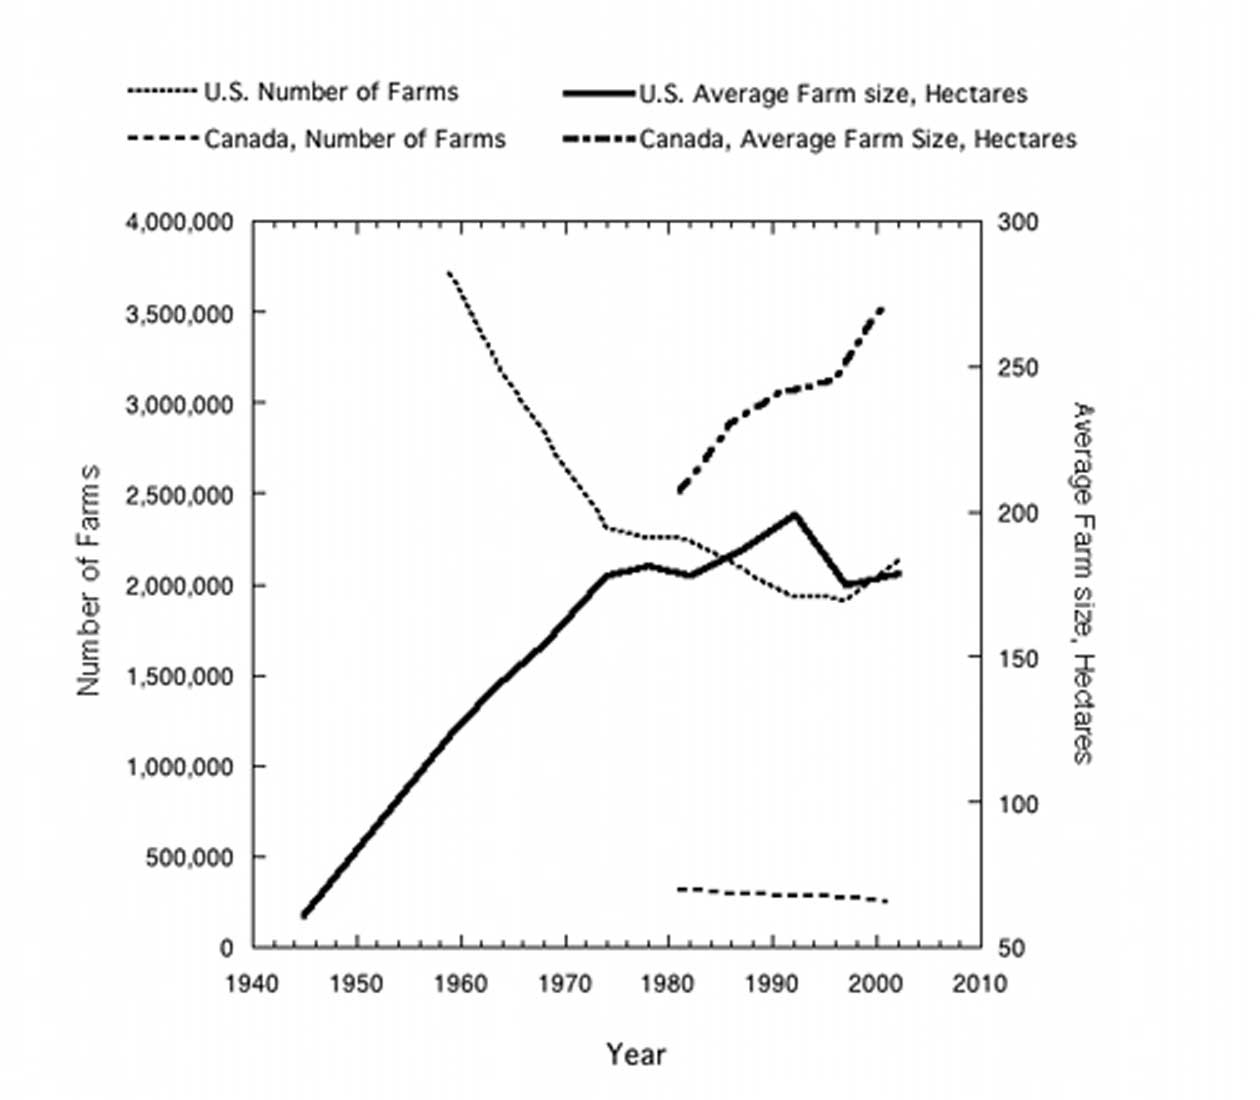
Figure 2-1. Change in farm size and number of farms in North America from 1940-2000. Source: USDA data; author elaboration.
North America, specialization occurred largely because of economies of scale, larger economic forces and technological change. When economies of scale (the unit cost decreases with size) prevails over economies of scope (synergies between products and by-products), specialization increases which is followed by an increased size in production units. This leads to regional specialization and concentration. Government policies may also influence farm size and numbers. Agricultural policies after World War II directly promoted specialization through incentives (e.g., Pirog et al., 2001; for a fuller discussion of policies see 2.2). Yet larger trends have usually overshadowed the impact of policy programs on farm structure. |
|
Table 2-1. 100 years of structural change in U.S. agriculture. Source: Dimitri and Effland, 2005.
Source: Dimitri and Effland, 2005. |
||||||||||||||||||||||||||||||||||||
| Previous | Return to table of contents | Search Reports | Next |
| « Back to weltagrarbericht.de | ||