| Previous | Return to table of contents | Search Reports | Next |
| « Back to weltagrarbericht.de | ||
504 | IAASTD Global Report
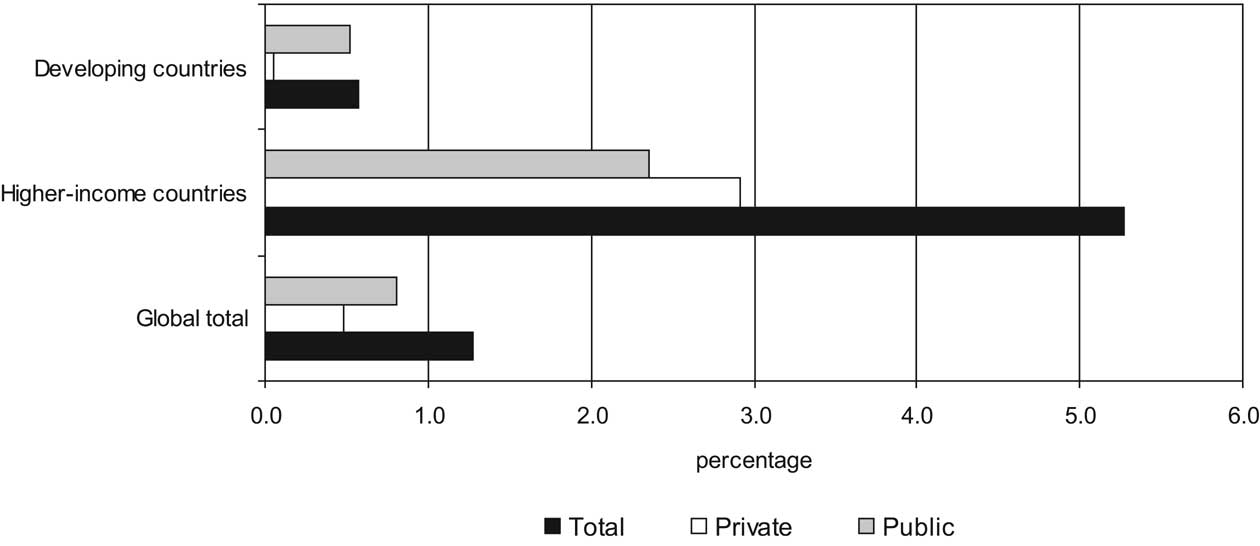
Figure 8-5. Public, private and total agricultural research intensities, 2000. Source: Pardey et al., 2006b based on ASTI data.
Note: The intensity ratios measure total public and private agricultural R&D spending as a percentage of agricultural GDP.
levels are much lower for the developing countries. Most countries, especially those in Africa, spent less than $3 per capita in 2000; while 59% of the industrialized countries invested more than $10 per capita in 2000. In contrast to the group of rich countries, agricultural R&D spending per capita for the developing countries as a group continued to increase from $2.12 per capita in 1981 to $2.72 in 2000. The exception is SSA where spending per capita has declined during the 1981-2000 period. 8.1.1.4 International agricultural R&D |
|
during the 1960s. In 1971 these centers formed the basis for the Consultative Group on International Agricultural Research (CGIAR or CG). Currently there exist 15 centers (see Chapter 2.2.4), with a total budget of US$415 million in 2004—US$384 million in 2000 prices. Although the CG system has played an important role in the Green Revolution, it only spends a small part of total of the global agricultural R&D investment. In 2000, the CG represented 1.6% of the US$23 billion global public sector investment in agricultural R&D (from 0.8% in 1981); 2.9% when spending by the rich countries is excluded (Pardey et al., 2006a). |
Table 8-5. Other intensity ratios, 1981, 1991 and 2000.
Public agricultural R&D spending |
||||||
|
Per capita |
Per capita of economically active agricultural population |
||||
|
1981 |
1991 |
2000 |
1981 |
1991 |
2000 |
(2000 international dollars) |
||||||
Asia & Pacific |
1.31 |
1.73 |
2.35 |
3.84 |
5.23 |
7.57 |
Latin America & Caribbean |
5.43 |
4.94 |
4.96 |
45.10 |
50.54 |
60.11 |
sub-Saharan Africa |
3.14 |
2.69 |
2.28 |
9.79 |
9.04 |
8.22 |
West Asia & North Africa |
3.24 |
3.63 |
3.66 |
19.15 |
27.30 |
30.24 |
Developing countries, subtotal |
2.09 |
2.34 |
2.72 |
6.91 |
8.14 |
10.19 |
Higher-income countries, subtotal |
10.91 |
13.04 |
11.92 |
316.52 |
528.30 |
691.63 |
Total |
3.75 |
4.12 |
4.13 |
14.83 |
16.92 |
18.08 |
| Previous | Return to table of contents | Search Reports | Next |
| « Back to weltagrarbericht.de | ||