| Previous | Return to table of contents | Search Reports | Next |
| « Back to weltagrarbericht.de | ||
Agricultural Knowledge, Science and Technology: Investment and Economic Returns | 503
Table 8-4 Total S&T spending by region and shares agriculture in total, 2000.
|
S&T spending |
Shares in global total S&T spending |
Agricultural R&D as a share of total S&T spending |
|
(millions 2000 international dollars) |
(percent) |
|
Asia & Pacific (26) |
94,950 |
13.4 |
8.6 |
Latin America & Caribbean (32) |
21,244 |
3.0 |
12.1 |
sub-Saharan Africa (44) |
3,992 |
0.6 |
37.2 |
West Asia & North Africa (18) |
14,893 |
2.1 |
9.6 |
Developing countries, subtotal (120) |
135,079 |
19.1 |
10.1 |
Higher-income countries (23) |
573,964 |
80.9 |
3.9 |
Total (143) |
709,043 |
100 |
5.1 |
Note: These estimates exclude East Europe and former Soviet Union countries. The number of countries included in
regional totals is shown in parentheses. Regional sample sizes are slightly different from those in Table 8-1.
Source: Pardey et al., 2006b.
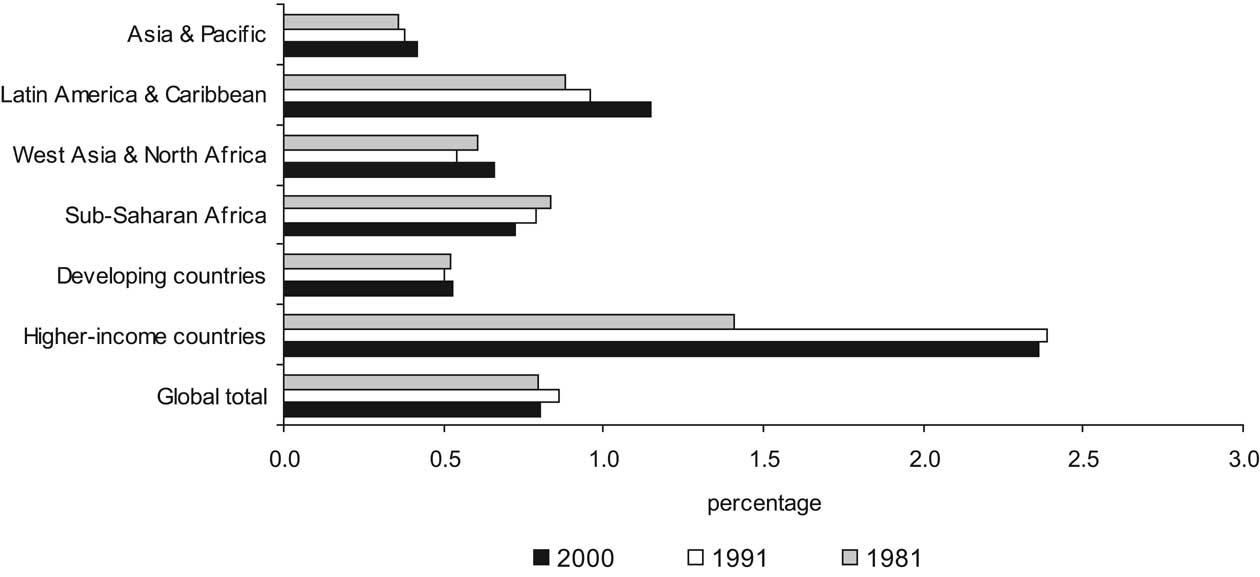
which data exists have higher research intensity ratios in 2000 than they did in 1981 (and the majority of them spent in excess of $2.50 on public agricultural R&D for every $100 of AgGDP). Most countries in our Asian and Latin American sample (9 out 11 Asian countries and 8 out of 11 Latin American countries) increased their intensity ratios over the 1981-2000. Only six of the 26 countries in SSA had higher intensity in 2000 compared to two decades earlier. The large and growing gap between developing and industrialized countries as groups is even larger in terms of total, i.e., public and private, agricultural research spending (Figure 8-5). In 2000, the intensity of total spending was nine times higher in rich countries than in poor ones; and four times higher than when only public research spending is used as the basis of the intensity calculation. |
|
agricultural research per agricultural worker in 2000, more than double the corresponding 1981 ratio (Table 8-5). The developing countries as a group spent just $10 per agricultural worker in 2000, substantially less than double the 1981 figure. These differences are not too surprising considering that a much smaller share of the workforce in industrialized countries is employed in agriculture, and the absolute number of agricultural workers declined more rapidly in these countries than it did in the developing countries. |
Figure 8-4. Intensity of public agricultural R&D investments over agricultural output. Source: Pardey et
al., 2006b based on ASTI data.
Note: The intensity ratios measure total public agricultural R&D spending as a percentage of agricultural GDP.
| Previous | Return to table of contents | Search Reports | Next |
| « Back to weltagrarbericht.de | ||