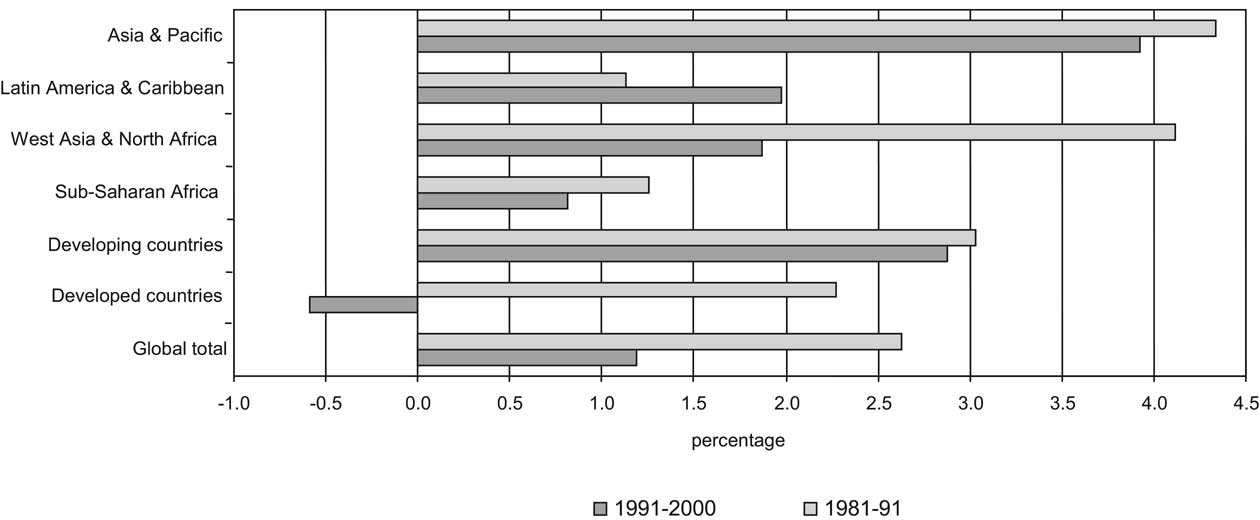
rate in total spending in China and India increased during the 1990s. This was in part due to an increase in total agricultural R&D spending in both countries during the second half of the 1990s, which reflects new government policies to revitalize public agricultural research and improve its commercialization prospects. Two other regions, Latin America and the Caribbean, and West Asia and North Africa, both experienced relative less growth in total spending during the 1990s (2.0 and 3.3%, respectively). In contrast, the increase in total spending in sub-Saharan Africa decreased in the 1990s from 1.3 to 0.8% compared to a decade earlier. An even more severe drop in spending is found in many sub-Saharan African countries. In about half of the 24 countries for which time series data were available, the public sector spent less on agricultural R&D in 2000 than 10 years earlier.
Noteworthy is the decline in total agricultural R&D spending among the rich countries; during the 1990s total spending declined by an annual rate of 0.6%. Specifically Japan, and to a lesser degree a few European countries, reduced their investments in agricultural research. Support for publicly performed agricultural research among rich countries has declined over a long period in time due to changes in government spending priorities and a shift toward privately performed agricultural R&D. These slowdowns in agricultural R&D spending may curtail the future spillovers of technologies from rich to poor countries (Pardey et al., 2006a) (see 8.2.7).
The allocation of resources among various lines of research is a significant policy decision and takes place at different levels and, in theory (although not always in practice), follows the priorities set across commodity and multidisciplinary research programs. More than one half of the full-time equivalent (fte) researchers in a sample of 45 developing countries conducted crops research while 15% focused on livestock and 8% on natural resources research (Table 8-2). Asia-Pacific had relatively less livestock research- |
|
ers (13%) than sub-Saharan Africa and Latin America (18% each). Forestry, fisheries, and postharvest accounted for 4 to 6% each. The remaining 9% of the research staff in the developing world conducted research in other agriculture related sciences.
For all three regions, fruits and vegetables are among the major crops being researched. Unsurprisingly, rice is a relatively important crop in the Asia-Pacific region while maize has high importance in Latin America.
The allocation of resources above does not cover the full scope of AKST, e.g., areas of importance in the future may include bioenergy, climate change, transgenics and biodiversity. The Stern Review on the Economics of Climate Change (Stern, 2007) concludes that an annual investment of 1% of global GDP is required to mitigate the negative effects of climate change. Although economists argue whether the figures in the Stern review are right, most agree that the cost of failing to tackle climate change will so vastly outweigh the cost of succeeding that further refinement of the calculations are largely irrelevant to the political and investment choices that must be made now. Among these could be the creation of incentives for investment in low-carbon technologies.
Some limited information on the budget levels in bioenergy R&D in OECD countries is available through the International Energy Agency (IEA). Total R&D budgets for bioenergy are estimated to have increased almost three-fold since 1992 to a total of $271 million (in 2005 international dollars) in 2005. Despite the increased interest in renewable energy and energy-saving technological innovations to mitigate climate change, total budgets on energy R&D in OECD countries, in adjusted terms, have remained flat since 1992. As a result, the share of bioenergy R&D in total energy R&D investments also grew almost threefold during 1992-2005 (IEA, 2006).
In this chapter, public agricultural research includes research performed by government, higher education, and nonprofit agencies. There are substantial differences among |