498 | IAASTD Global Report

group invested more on public agricultural R&D than the combined total in the industrialized world. Investments by Asia and Pacific countries as a group grew relatively result­ing in an increasing share of the global total; the regional share was 33% in 2000 compared to only 20% in 1981. Most of this growth took place during the late-1990s. In contrast, the corresponding share for sub-Saharan Africa continued to decline, falling from 8 to 6% of the global total between 1981 and 2000.
        Public agricultural R&D has become increasingly con­centrated in just a handful of countries. Among the rich countries, the United States (US) and Japan accounted for 54% of public spending in 2000; about the same as two decades earlier. Three developing countries, China, India, and Brazil, spent 47% of the developing world's public ag­ricultural research total, an increase from 33% in 1981. Meanwhile, only 6% of the agricultural R&D investments worldwide were conducted in 80 countries that combined had a total to more than 600 million people in 2000.
         Growth in inflation-adjusted spending has slowed down since the 1970s when most regions experienced high growth rates (Figure 8-2). Overall spending in the Asia and Pacific region increased with an annual growth rate of 3.9% dur­ing the 1990s; lower than the regional growth in the 1980s (Beintema and Stads, 2006). However the average growth


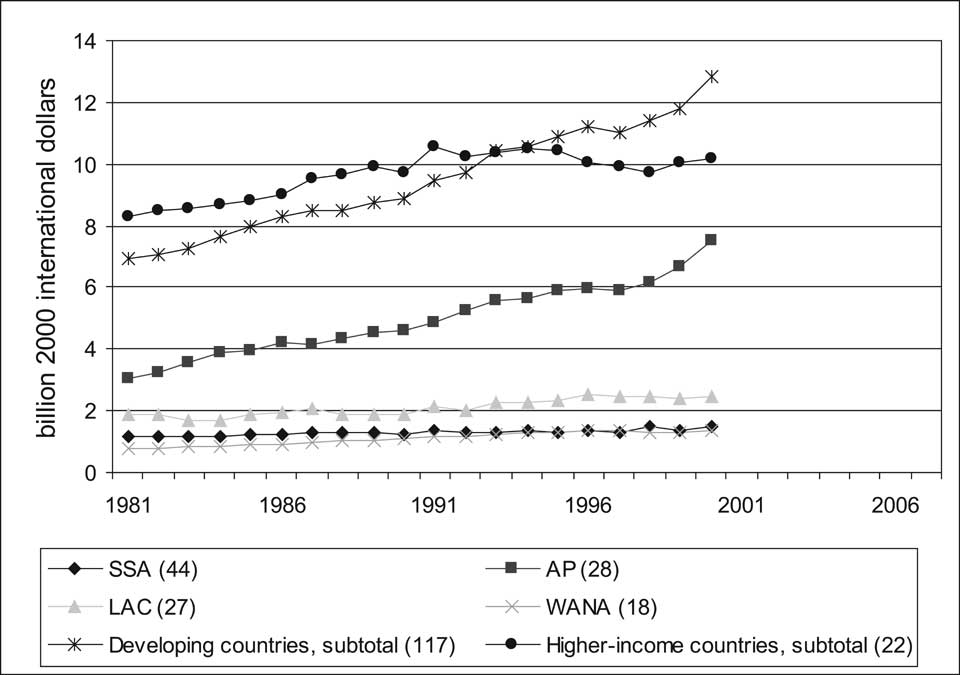
Figure 8-1. Total public agricultural research expenditures by region, 1981-2000. Source: Pardey et al., 2006b based on Agricultural Science and Technology Indicators (ASTI) data at www.asti.cgiar.org
Note: See Table 8-1


Agricultural R&D spending

Shares in global total


1981

1991

2000

1981

1991

2000


(million 2000 international dollars)


(percent)


Asia & Pacific (28)

3,047

4,847

7,523

20.0

24.2

32.7

China

1,049

1,733

3,150

6.9

8.7

13.7

India

533

1,004

1,858

3.5

5.0

8.1

Latin America & Caribbean (27)

1,897

2,107

2,454

12.5

10.5

10.7

Brazil

690

1,000

1,020

4.5

5.0

4.4

sub-Saharan Africa (44)

1,196

1,365

1,461

7.9

6.8

6.3

West Asia & North Africa (18)

764

1,139

1,382

5.0

5.7

6.0

Developing countries, subtotal (117)

6,904

9,459

12,819

45.4

47.3

55.7

Japan

1,832

2,182

1,658

12.1

10.9

7.2

USA

2,533

3,216

3,828

16.7

16.1

16.6

Subtotal, higher-income countries (22)

8,293

10,534

10,191

54.6

52.7

44.3

Total (139)

15,197

19,992

23,010

100.0

100.0

100.0

Notes: The number of countries included in regional totals is shown in parentheses. These estimates exclude East Europe and former Soviet Union countries. The high-income countries total excludes a number of high income countries such as South Korea and French Polynesia (which has been grouped in the Asia and Pacific total), Bahrain, Israel, Kuwait, Qatar, and United Arab Emirates (grouped in West Asia and North Africa), and Bahamas (Latin America and Caribbean). To form these regional totals national spending estimates were scaled up for countries that represented 79% of the reported sub-Saharan African total, 89% of the Asia and Pacific total, 86% of the Latin America and Caribbean total, 57% of the West Asia and North Africa total, and 84% of the high-income total.


Source: Pardey et al., 2006b based on Agricultural Science and Technology Indicators (ASTI) data at www.asti.cgiar.org.