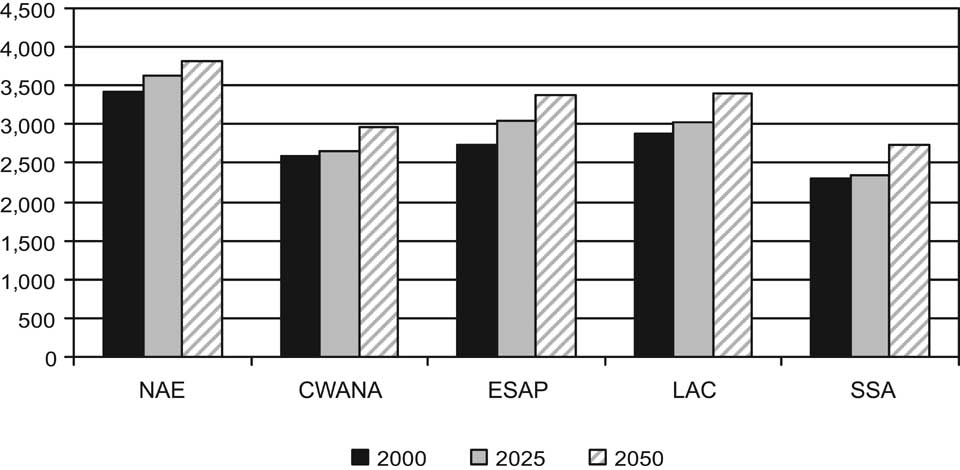
Figure 5-8. Average daily calorie availability per capita, selected regions, reference run. Source: IFPRI IMPACT model simulations.
2% value is based on recent FAO reports on the growth of aquaculture (FAO/WHO, 2006; see also Table 5-11).
Atlantic Ocean. Under the reference run there is an overall decline in landings (5.4%) between 2003 and 2048 but under the 2% increase in small pelagic effort variant there is a 7% increase in landings. In both alternatives the trophic level of the catch declines between 2 and 2.5%. Six FAO areas are represented in the Atlantic, and in all areas except 34 and 21 landings increase in the reference run and trophic level declines. In FAO areas where landings continue to decline, the trophic level in Area 34 is the only area where it increases while in Area 21 it continues to decline. In the 2% effort variant landings in most areas increase or remain steady except in Area 21 where it declines. The trophic level decreases in all but Area 31 where it increases slightly. The changes in bio-mass of the major species is seen in increases in small pelagic fish (e.g., capeline, herring) and declines in large demersal and large bentho-pelagic fish (e.g., cod, haddock).
Pacific Ocean. The baseline modeling for the Pacific results in declines in landings by 5% from 203 to 2048, while in the 2% increase in effort in the small pelagic fleet there is an overall increase (117%) in landings. The trophic level remains unchanged in the baseline but declines by 1.3% in the small pelagic effort variant. Six FAO areas are included in the Pacific and much of the change in landings in the
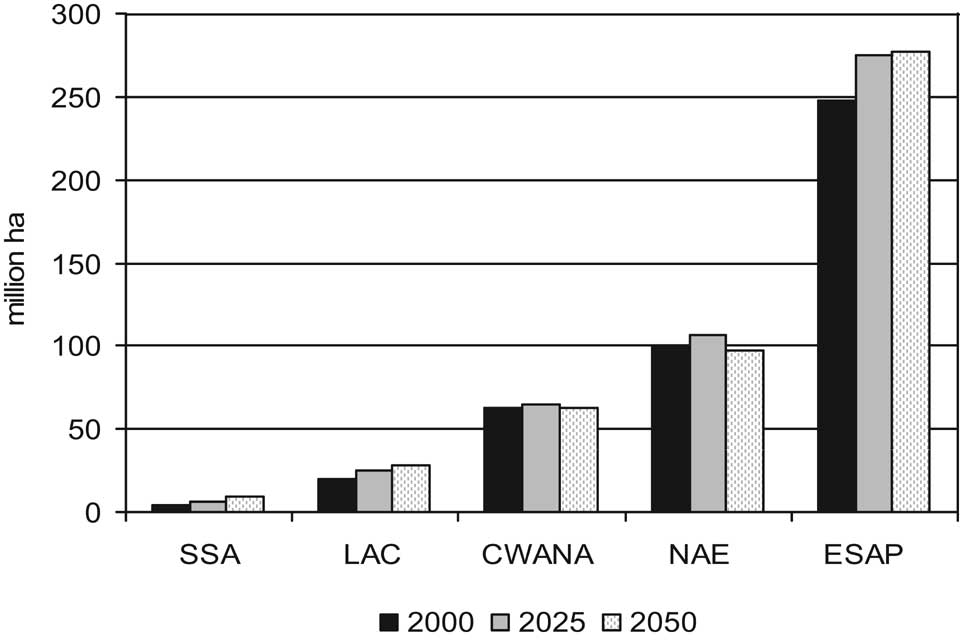
Figure 5-9. Number of malnourished children, 2000 and projected 2025 and 2050, selected developing country regions. Source: IFPRI IMPACT model simulations.
reference run can be attributed to Areas 77, 67 and 61 and changes in trophic levels can be attributed to Area 87. However, in the 2% effort variant the landings increase in most FAO areas but the trophic level only declines in FAO Areas 87 and 61. Much of the change in landings and trophic level are due to increasing biomass of small pelagics and declining biomass of most other groups.
Indian Ocean. In the reference run landings initially decline while stocks rebuild and then landings increase but only to 1% more than in 2003 by 2048. However, the trophic level of the catch does not decline with increased landings. Landings increase in the 2% effort variant. The growth is small, less than 5% but also the sustainability of these fisheries policy is uncertain since the trophic level of the catch continues to decline under the 2% policy from 2003 to 2008. The Indian Ocean represents two FAO Areas (51 and 57) and much of the overall increase in landings is due to increased small pelagic biomass in Area 57.
Mediterranean. Landings in the reference run increase by 7% with a corresponding decline in trophic level of 3%. In the 2% small pelagic effort variant, landings increase by 50% then level off while the trophic level declines steadily and by 3% from 2003. The sustainability of this policy is
Table 5-11. Fisheries, reference run.
| FAO Area | Baseline | % change in trophic level 2003 to 2048 | 2% increase | % change |
| % change in landings 2003 to 2048 | % change in landings 2003 to 2048 | in trophic level 2003 to 2048 | ||
| Atlantic | ||||
| 21 | -39 | -5.9 | -35 | -6.0 |
| 27 | 15 | -1.5 | 22 | -2.4 |
| 31 | 20 | 2.8 | 25 | 2.3 |
| 34 | -30 | 1.1 | 3.9 | -1.3 |
| 41 | 26 | -1.2 | 34 | -1.9 |
| 47 | 33 | -3.1 | 13.9 | -0.9 |
| Pacific | ||||
| 61 | 19 | -2.3 | 14 | -2.7 |
| 67 | 47 | -2.8 | 44 | -2.6 |
| 71 | -15 | 0.5 | 11.4 | -0.9 |
| 77 | 56 | 1.5 | 47 | 0.4 |
| 81 | 13 | -0.1 | 2.8 | -0.2 |
| 87 | -38 | 3.9 | 13 | -1.8 |
| Indian | ||||
| 51 | -21 | 1.3 | -10 | -1.3 |
| 57 | 73 | 4.8 | 56 | 2.1 |
| Med 37 | 71 | -3.8 | 50 | -3.1 |
Source: ECO-OCEAN.