This notion is underlying most projections. Stage one refers to a preindustrial society where both birth and death rates are high and fluctuate rapidly. In stage two, the death rates decline rapidly due to better economic, environmental and health conditions with increase in life spans and decrease in disease attacks. This stage began in Europe during the Agricultural Revolution of the 18th century. Less developed countries entered this stage in the second half of the last century. In stage three, birth rates decline and population moves towards greater stability due to increases in urbanization, female literacy and improvements in contraceptive measures. During stage four, there are both low birth and death rates. In 43 developed countries (accounting for about 19% of the world population) fertility has dropped to well below the replacement level (two births per woman) leading to a shrinking population.
International migration is also important factor that determines the future population size and composition. However, compared to fertility and mortality, future international migration is more difficult to predict because it is often influenced by short-term changes in social, economic and political developments (see also 4.3.3). It is estimated that during 2005, about 191 million persons (representing 3% of the world population) were migrants (UN, 2005b). Of these, 60% reside in the more developed regions, while the remaining 40% reside in less developed regions. How these numbers will change is important for future regional and national demographic developments. Scenario developers have tried to capture international relationships by describing changes in these factors in the storylines (e.g., IPCC, 2000; MA, 2005a), but there has been little feedback into the demographic assumptions (the MA is an exception).
4.3.1.2 Global population: Current trends and projections
The population projections used in international assessment mostly originate from two important demographic institutions: the United Nations Population Division (UN, 2004) and the probabilistic projections from the International Institute for Applied System Analysis (IIASA) (IIASA, 2001; Lutz et al., 2001, 2004). However, population projections are also provided by the US Bureau of Census (US Census Bureau, 2003) and the World Bank (World Bank, 2004b). The range of the most commonly used projections indicates an increase of the global population from 6.5 billion today to 6.9 to 11.3 billion in 2050. The range of the latest UN scenarios spans a range from 7.7-10.6 billion (with 9.3 billion median) for 2050 (Figure 4-3). These numbers are considerably lower than demographic projections that were published in the past. The most important reason for this is that fertility trends have been revised downwards in response to recent trends. This implies that the realization of these projections is contingent upon ensuring that couples have access to family planning measures and that efforts to arrest the current spread of the HIV/AIDS epidemic are successful in reducing its growth momentum.
Different global assessments have used different population projections (Table 4-4). The Special Report on Emission Scenarios (SRES), the Global Environment Outlook and the Millennium Assessment Working Group each used scenarios that covered a wide range of possible outcomes (all within the IIASA 95% probability interval). A compari-
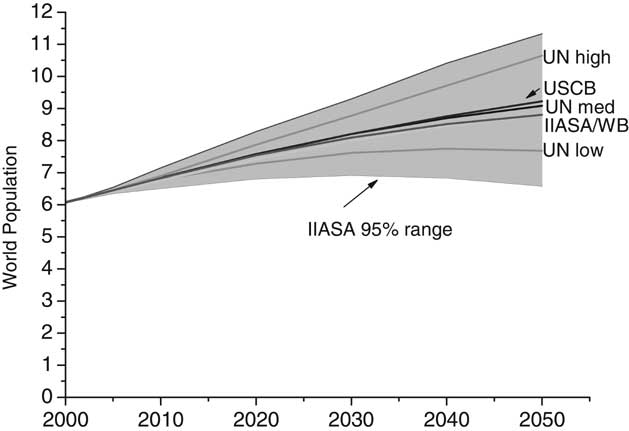
Figure 4-3. Projected global population (present-2050) according to different scenarios.
son of these scenarios with the most recent projections for the world shows a downward revision to the medium projections. This implies that older assessments (e.g., the IPCC SRES scenarios) tend to have higher population projections than more recent assessments (the higher population projections of the IPCC-SRES are by now less plausible but not impossible). Among the total set of demographic projections, the Millennium Ecosystem scenarios are most advanced as it used explicit storyline elements to specify trends in total population numbers and also to specify the assumptions for underlying dynamics.
All scenarios indicate that the global population is mainly driven by population increases in less developed regions. In the UN medium scenario by 2050, the population of most developed regions declines by about 1.2 million per year while, in less developed regions, there is an increase of 35 million per year and the least developed countries experience an increase of about 22 million per year. As this trend is basically repeated in all other scenarios, one concludes that least developed countries will be the primary contributors to the increase in population; this situation may aggravate poverty.
Less information is generally found on international migration. Looking at the UN medium scenario, during the 2005-2050 period, the net number of international migrants from less to more developed regions is projected to be 98 million (UN, 2005b) at the rate of 2.2 million per annum. This migration rate is likely to have substantial changes on the age structure, size and composition of the population of the receiving nations and lead to populations of mixed origin. In the MA scenarios, the migration assumptions at the global level have been coupled to storylines, with high migration rates in scenarios assuming further globalization and lower rates in scenarios assuming stronger regional emphasis.
4.3.1.2 Urbanization and ageing of world population
Most assessments do not specify the extent of urbanization; however, the underlying UN scenarios provide information. In the UN medium projection, the world's urban population reached 3.2 billion persons in 2005 and is expected