| Previous | Return to table of contents | Search Reports | Next |
| « Back to weltagrarbericht.de | ||
28 | IAASTD Global Report
|
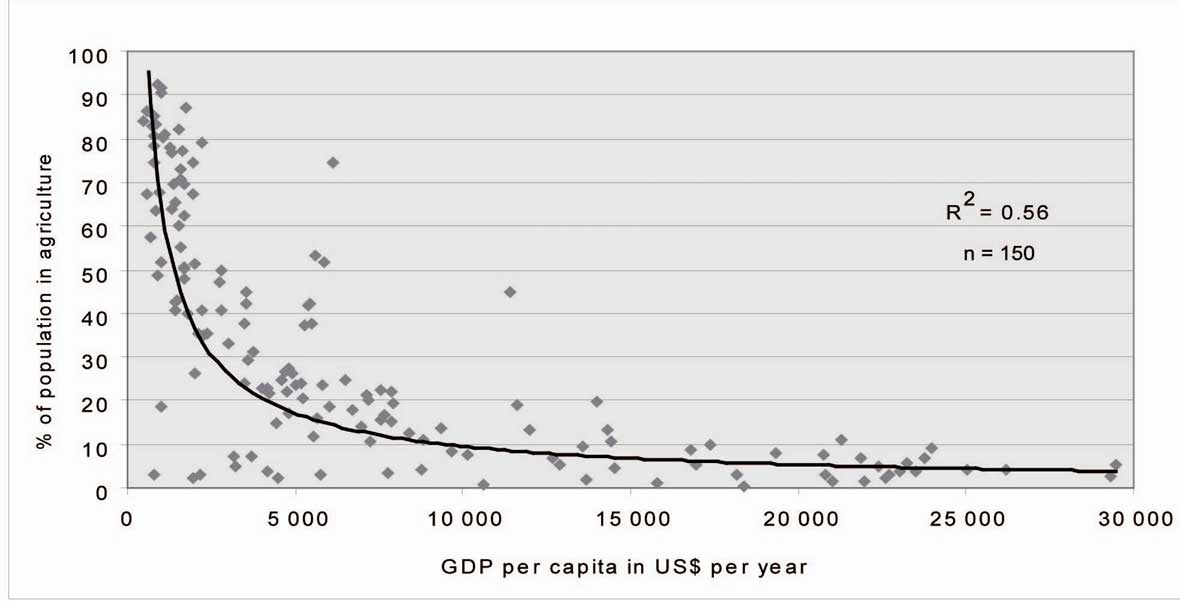
cash, and may come from both on-farm and off-farm sources. Gross national income per capita averaged US$1,502 in developing countries in 2004, or about US$4 per day (World Bank, 2006c); half the people in developing countries live on less that US$2 per day, and 19% live on less than US$1 per day (World Bank, 2006c). By contrast, income per capita in high-income countries averaged US$32,112 in 2004, or about US$88 per day. Generally, there is a strong correlation between the average income per capita and the share agriculture takes in GDP. The lower this share is, the higher the income (see Figure 1-13). A simple measure of economic well-being can be derived by comparing an individual's or household's income over a given period of time with their needs or wants over that same period of time. The disadvantage of such a simple measure is that it could indicate that a household was welloff at present even if it was increasing its income in the short term by depleting its resources in a way that is unsustainable over the long term. Thus a more complete measure of economic well-being requires knowledge about the resources from which an individual or household derives its income. Resources. Control of resources shapes income-generating opportunities, and determines how resilient households are when incomes fluctuate in response to changing economic conditions or natural disasters. Resources can be grouped in various ways, e.g., natural, human and social capital and wealth (or man-made capital) (Serageldin, 1996). Wealth can be further divided into physical and financial forms (Chambers and Conway, 1991). Access to different forms of capital varies widely across and within regions, affecting the choices that households make in combining resources in their diverse livelihood strategies, and also affecting the types of AKST investments that are most relevant in any particular context. An important aspect of resources is the discussion of labor productivity versus land productivity. These are often |
compared to show the differences between the achievements of formal AKST versus local knowledge. The value of production in industrialized countries is much higher than in developing countries (Wood et al., 2000), simply because the energy balance is hardly taken into account when comparing mechanized with manual agricultural systems. It is noteworthy, however, that there are groups of countries where labor productivity made particular progress (probably through mechanization), while others made most progress in land productivity, and sub-Saharan countries had only little advances over the past 30 years, although with probably the best energy balance (Byerlee et al., 2005). Latin America has the highest levels of labor productivity in the developing world, followed by the Middle East and North Africa, and transition economies. South-East Asia and sub- Saharan Africa have considerably lower labor productivity levels although, in terms of growth, China is leading (ILO, 2004; see Figure 1-14). Education. Reported gross primary school enrolment rates are near universal in developing countries already, but completion rates are lower, and more than 100 million children of primary school age remain out of school. Gross enrolment rates drop to 61% for secondary education and 17% for tertiary education (World Bank, 2006c). Primary and secondary education are near-universal in high-income countries, and drop to 67% for tertiary education. Adult literacy rates in developing countries are 86 and 74% for men and women, respectively (World Bank, 2006c). Research. Expenditures for public agricultural research and development (R&D) averaged 0.5% of agricultural GDP in high-income countries (Pardey et al., 2006), which in view of the high disparity between the GDPs themselves must be seen as a potentially greatly underrated difference. Moreover, about five times as many scientific and technical journal articles were published by authors from high-income |
Figure 1-13. World distribution of GDP per capita and percentage of population working in agriculture (Average of years 1990-2002). Source: Based on Hurni et al., 1996, with data from World Bank, 2006c; ILO, 2007.
| Previous | Return to table of contents | Search Reports | Next |
| « Back to weltagrarbericht.de | ||