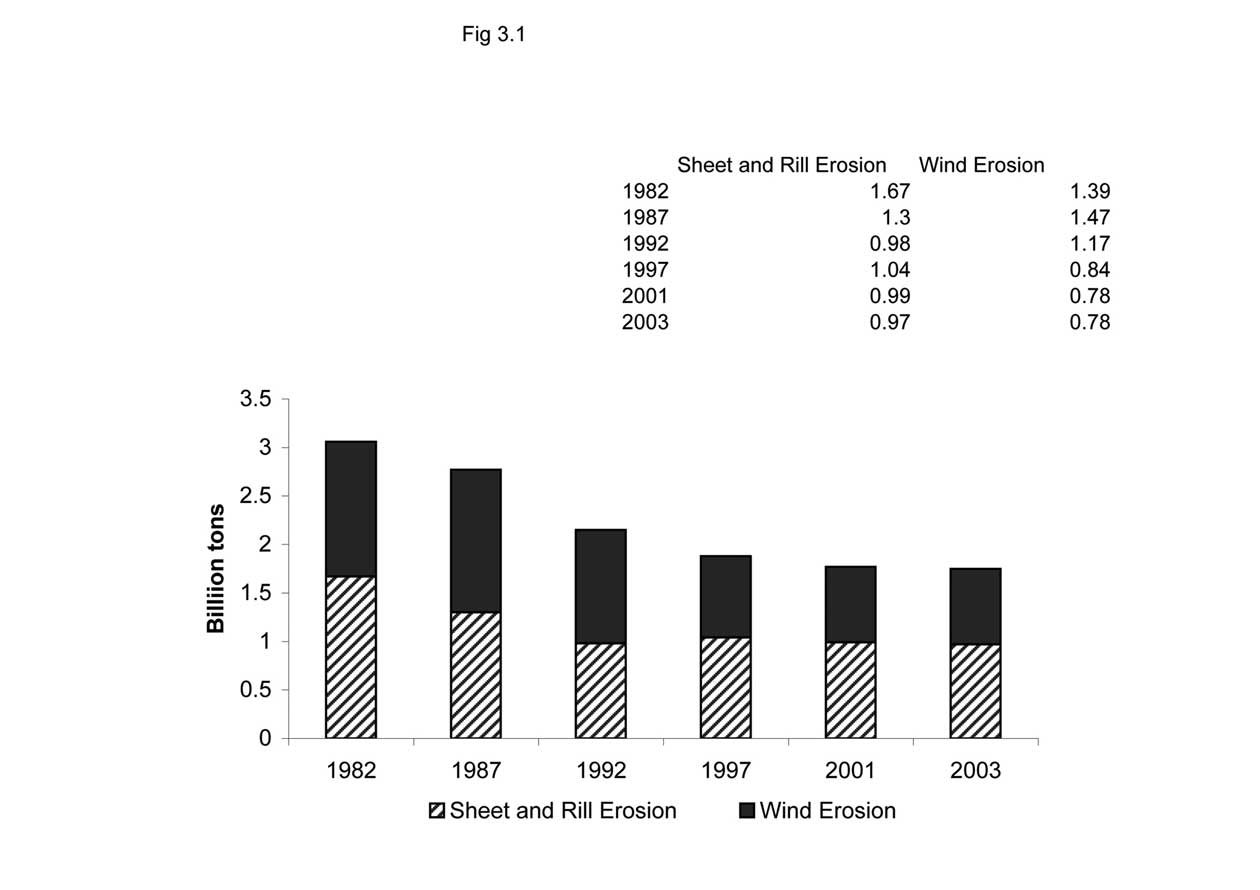
Figure 3-1. Erosion on cropland by year in the US. Source: USDA-NRCS, 2003.
intensive feeding operations which produce large amounts of manure, a local oversupply of fertilizer may be created which if not properly managed can also cause pollution (see 3.1.2).
Phosphorus from agriculture can contribute to eutro-phication of fresh waters and agricultural nitrogen to eutro-phication of coastal marine waters (Lavelle et al., 2005). In recent decades concern over eutrophication has been focused
on effects in coastal waters, as there are numerous hypoxic zones in the coastal waters of North America and Europe (UNEP, 2004). The contribution of agricultural nitrogen to coastal eutrophication in different watersheds is quite variable (NRC, 2000) and depends upon the relative amount of atmospheric deposition of nitrogen from combustion sources and point sources in the watershed. Nevertheless, it is clear that agricultural nitrogen is often a significant, if not the major source.
Ammonia emissions to the atmosphere from manure and ammonia-based fertilizers can contribute to local odor problems. The ammonia can be converted to nitrate in the atmosphere, contributing to acid rain and the nitrogen will be redeposited, contributing to eutrophication. Another volatilization path results in production of nitrous oxide (N2O), a greenhouse gas of importance secondary only to carbon dioxide and methane. The increased soil nitrogen availability from agricultural fertilization has led to greater NO production.
Use of appropriate on-field farming practices can make major reductions in fertilizer runoff and emissions without significant reductions in agricultural productivity (Table 3-1). Significant runoff reductions can be achieved through use of uncropped "set-aside" areas as buffer zones and wet-