share of agriculture in the national economy and (4) the growing influence of the "non-traditional" interest groups such as agri-business, food industry, NGO's (like environmental and consumer associations), food-safety lobbies and in the international AKST also farmer organizations (Alston etal., 1998).
4.5.3 Development of funding and agenda in NAE in the global context
4.5.3.1 Development in NAE
Public agricultural R&D expenditures
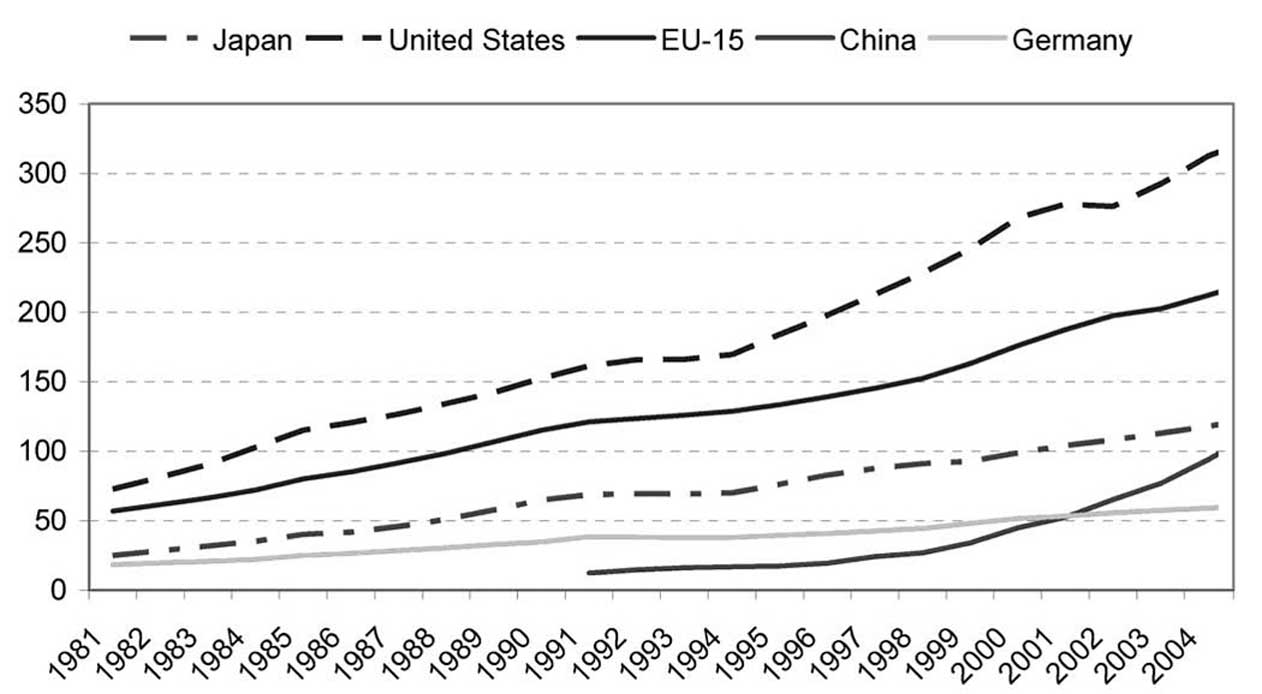
Between 1945 and the mid-1970s there was a period of rapid growth rates in public agricultural R&D expenditures in NAE. Many NAE countries financed large-scale expansions in their national science research-education systems. Alston et al. (1998) analyzed the data available for 22 OECD countries,9 which show that agricultural R&D spending in the OECD grew on average by 7 to 8% per year during the 1950s and 60s. Alston et al. (1998) suggested that such growth rates were probably not sustainable in the long term and that by the 1970s in many OECD countries publicly funded agricultural research had become a mature industry characterized by modest rather than rapid expansion. The 1970s saw a growth rate of 2.7% per year on average for the OECD analyzed. Some NAE countries had higher growth rates, e.g., the annual growth rate was 4.2% in the Netherlands for the period 1971-81. However, in the 1980s occurred a further decline in real public agricultural R&D expenditure growth rates in many regions of NAE (Figure 4-3, Table 4-4 [both in Annex H]). While the an-
9 OECD totals reported by Alston et al. (1998) included the following NAE countries: Austria, Belgium, Canada, Denmark, Finland, France, Germany, Greece, Iceland, Ireland, Italy, the Netherlands, Norway, Portugal, Spain, Sweden, Switzerland, the UK and the US. Non-NAE countries included in their data were Australia, Japan and New Zealand. |
|
nual growth rate in the US remained relatively stable (2.3% for the period 1981-93), the growth rate in the Netherlands was only 0.9% and expenditure even declined in the UK by 0.2% over the same period.
The dramatic declines in growth rate in the Netherlands and the UK were associated with relatively radical changes in the institutional organization and management of public agricultural research during the 1980s compared to other countries in NAE (Alston et al., 1998). In the 1990s public expenditures in NAE recovered somewhat but growth rates remained modest compared to the 1960s and 1970s. Despite minimal funding increases, demands on the public system grew increasingly complex due to increasing awareness of food safety issues, environmental externalities and increasing food consumption (Rubenstein and Heisey, 2005). This has led to efforts within the EU in recent years to coordinate funding for AKST to minimize duplication of research between member states. Such efforts have attracted criticism by the farming community concerned that they may reduce national competitiveness.
U.S. federal funding for extension has been declining in scope for more than a decade and support for agricultural experiment stations is also now under attack, partly because of an increasing preference for competitive grants over formula-based funding and also because of fragmentation of the constituency for such funds (Busch, 2005). The key niche occupied by colleges of agriculture has shrunk in scope and there has been a tendency to shed specialists dealing with minor crops while maintaining competence in major crops. These crops are, however, increasingly controlled by the private sector, while minor crops are of little interest to the private sector as they lack the potential for significant profit in input supply. These and other factors contributed to weaken the once strong links between farmers and especially farm commodity groups and colleges of agriculture (Busch, 2005). For more than a century, the colleges of agriculture were at the center of the research agenda in the US. They had few competitors as private biological research was mostly unprofitable. |