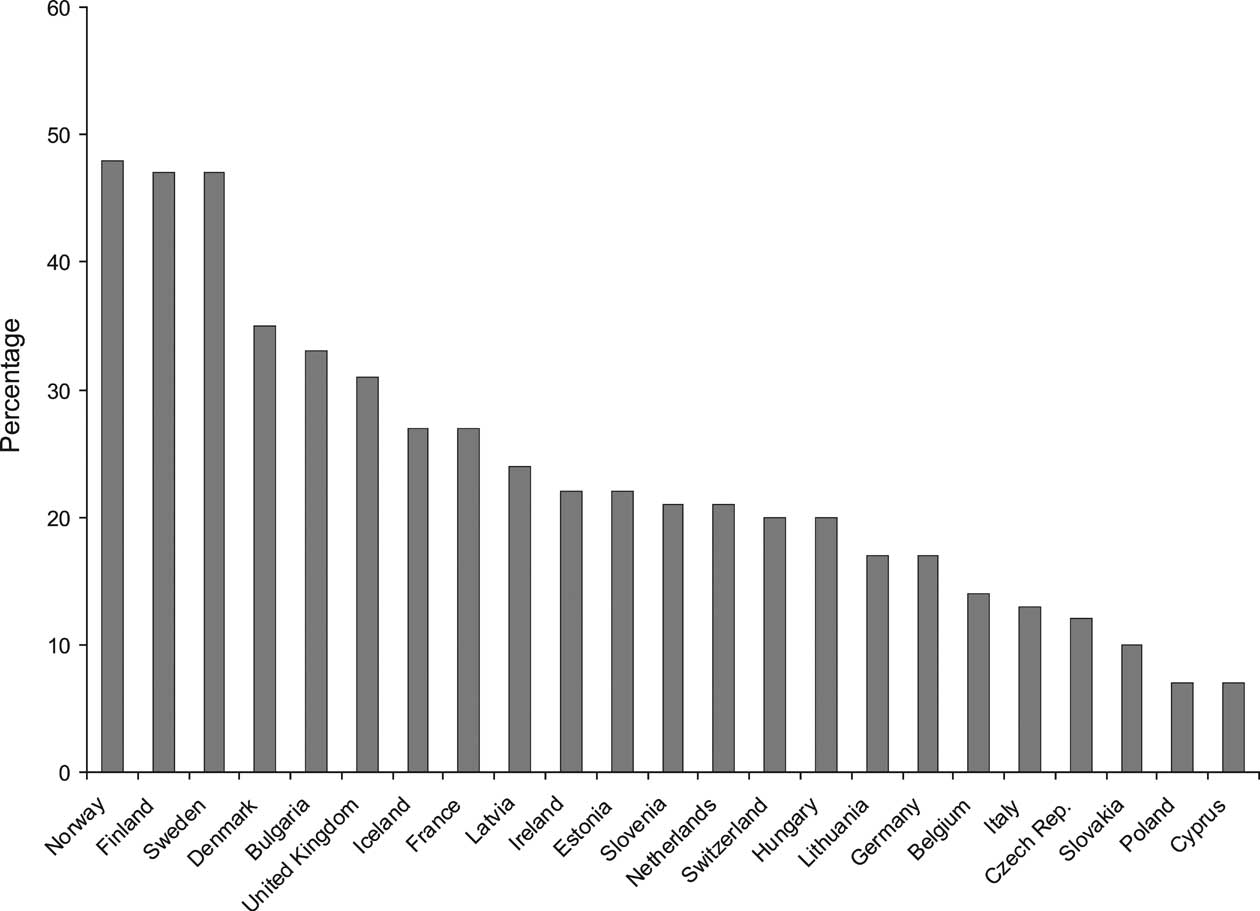
Figure 4-1. Women on scientific boards in EU countries in 2004. Source: adapted from EC, 2006
Table 4-1. Percentage of female professors in university faculties (different ranks, all disciplines).
Countrya |
Full professor |
Associate professor |
Assistant professor |
Year |
Turkey |
21.5 |
30.7 |
28.0 |
1996/7 |
Finland |
18.4 |
- |
- |
1998 |
Portugal |
17.0 |
36.0 |
44.0 |
1997 |
France |
13.8 |
34.2 |
- |
1997/8 |
USA |
13.8 |
30.0 |
43.1 |
1998 |
Spain |
13.2 |
34.9 |
30.9 |
1995/6 |
Canada |
12.0 |
- |
- |
1998 |
Norway |
11.7 |
27.7 |
37.6 |
1997 |
Sweden |
11.0 |
22.0 |
45.0 |
1997/8 |
Italy |
11.0 |
27.0 |
40.0 |
1997 |
Greece |
9.5 |
20.3 |
30.6 |
1997/8 |
UK |
8.5 |
18.4 |
33.3 |
1996/7 |
Iceland |
8.0 |
22.0 |
45.0 |
1996 |
Israel |
7.8 |
16.0 |
30.8 |
1996 |
Belgium (Fr.) |
7.0 |
7.0 |
18.0 |
1997 |
Denmark |
7.0 |
19.0 |
32.0 |
1997 |
Ireland |
6.8 |
7.5 |
16.3 |
1997/8 |
Austria |
6.0 |
7.0 |
12.0 |
1999 |
Germany |
5.9 |
11.3 |
23.8 |
1998 |
Switzerland |
5.7 |
19.2 |
25.6 |
1996 |
Belgium (Fl.) |
5.1 |
10.0 |
13.1 |
1998 |
Netherlands |
5.0 |
7.0 |
20.0 |
1998 |
a Figures for Portugal include only academic staff performing R&D activities. The French-speaking and the Flemish-speaking parts of Belgium keep separate statistics. Source: adapted from ETAN, 2000.
1995). In turn public science depends on industry for its instrumentation and research materials. Countries in NAE today spend up to 4% (Sweden) of their GDP on research and development (US, 2.7%; EU15, 1.9%; Russian Federation, 1.2%; Canada, 1.9%) (OECD, 2006a).
The increasing importance of knowledge, innovation and technology development for the economy together with globalization have made the world economy more dynamic. Diffusion of knowledge relevant to innovations throughout the economy is extremely important and here the traditional linear innovation model has shown weaknesses (Stokes, 1997). The systemic or interactive model of innovation, currently broadly accepted as a representative picture of how the innovation-driven economy works, postulates the need for dynamic and flexible structures and processes (OECD, 2002). While non-economic institutions often continue to develop along the earlier path (OECD, 2005c), a third generation of an innovation policy (going beyond the linear and interactive models) is emerging. It calls attention to the process of accommodation, especially in the area of governmental science, technology and innovation policy (OECD, 2005a, b and c). This horizontal process requires governments and institutions to be more flexible and to integrate policy formulation and implementation among ministries and across other institutional boundaries to improve coherence. Despite the challenges associated with expanding knowledge and science policy into a broader innovation policy, there seems to be both a need and an opportunity for such a change, especially in the context of sustainable development. Key barriers, based on case studies in different OECD countries, are lack of recognition of innovation policy as a key driver of sustainable development, separate "missions" and lack of understanding of related policies between different ministries (OECD, 2005c). Countries in NAE have faced different obstacles in this context and have proceeded on this path to different degrees.
4.3 General Trends of Paradigms in Societal Context
4.3.1 Paradigms in NAE AKST during the first half of the period
During the past century, agriculture in NAE faced two persistent challenges linked with industrialization: technology development and rising real wage rates in the non-farm sector. The agricultural sector has undergone a major economic and social change (see Chapter 2) as it has adjusted to these forces and become more integrated into the national and world economies. The wages available in non-farm employment represent an opportunity cost to farm labor when the two labor markets are integrated. Before 1933 farm input markets were poorly integrated with non-farm input markets but by the 1970s they had become well integrated (Huffman, 1996). In the US, real manufacturing wage rates rose by a factor of 5 from 1890 to 1990; real compensation rose faster, by a factor of 7.6. These large increases represent a powerful force for drawing labor away from agriculture, made on the other hand possible by, but also causing, labor saving technical change in agriculture (for opposing views see Hayami and Ruttan, 1971; Busch et al., 1984; Olmstead and Rhodes, 1994; Huffman, 1998a; Huff-