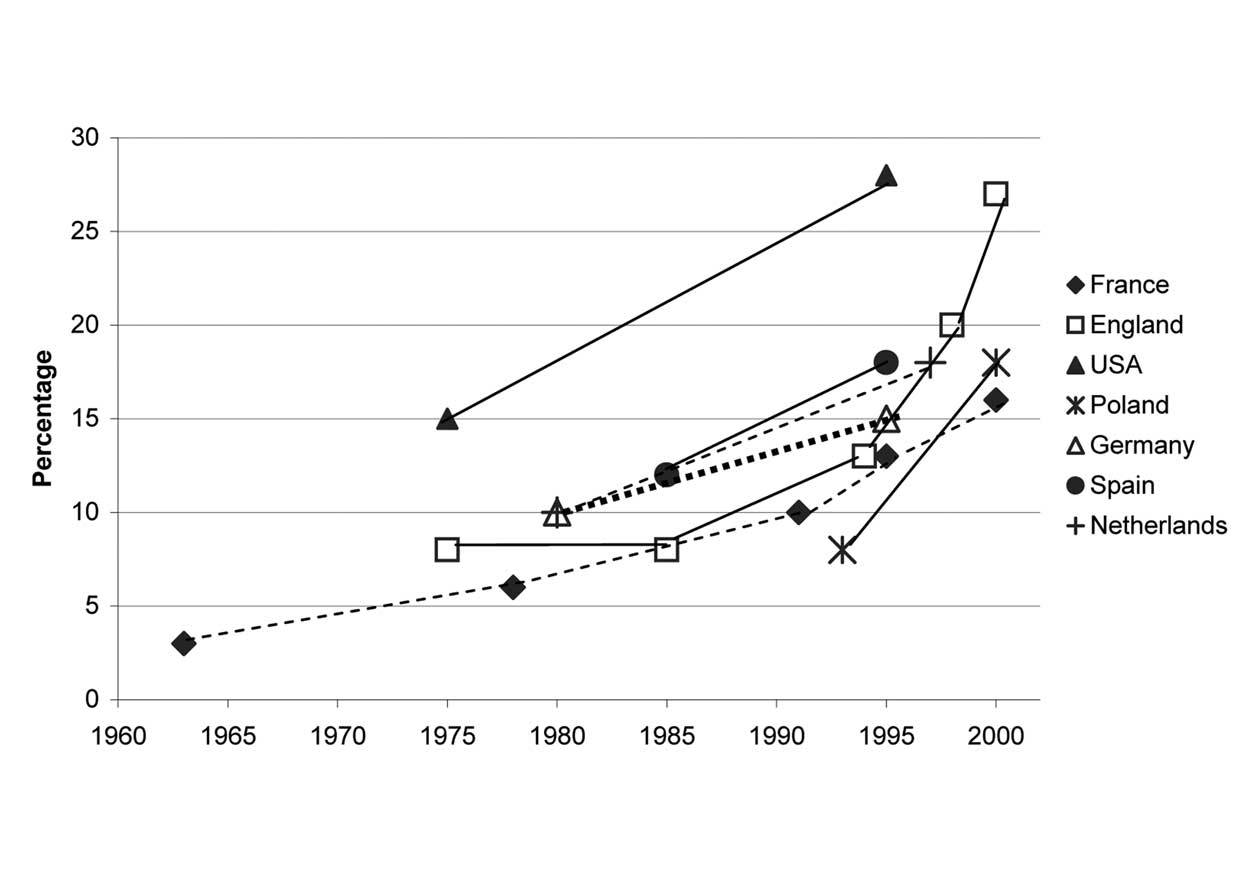
Figure 3-13. Prevalence of overweight children in NAE (ages 5-11). Source: International Obesity
Task Force, 2005
States are major players while trade flows with the Russian Federation are much smaller (Table 3-12). Trade has also been growing. Between 1986 and 2003, substantial changes in trade flows were associated with the breakup of the system of centralized command systems in the USSR and other parts of CEE. Beyond 2004 the EU became 25 countries rather than 15.
The US has been a net exporter while the EU has been a net importer (Figure 3-14). The EU has subsidized agricultural exports while the US support system for farmers, combined with Food Aid programs, has made their farm exports competitive. Subsidized exports damage low cost producers in both developed and developing countries who face lower prices and may even lose markets to products that are effectively dumped into the world market. The damage done by export subsidies and policies that have similar effect has played a major role in trade negotiations. With the creation of WTO, agriculture was brought within the multilateral trade negotiating scene and pressure has grown for export subsidies to be reduced and eventually removed and for there to be greater access to developed country markets for produce from developing countries.
The largest volume of agricultural trade in the EU is between its member countries. Much of the external trade takes place between the US and the EU (Figure 3-15). Many |
|
EU agricultural imports, particularly from the US and Brazil, are feedstuffs for the livestock industry rather than finished products.
For the US the most important destinations for exports are its neighboring countries Mexico and Canada within the North American free trade area. Outside this free trade area Japan and the EU represent the major destinations for North American exports. China has markedly increased imports since 2002 and is expected to continue to do so in the future. A major development that may change the flow of exports from North America is the use of an increasing share of the US maize crop to produce bioethanol rather than entering the food chain.
There is a similar concentrated pattern for US imports (see figures 3-16 and 3-17) but here the EU has recently overtaken Canada as the largest supplier. Imports from Mexico have risen relatively rapidly as a result of the North American Free Trade Agreement. Among the four largest suppliers only Australia secures its market without subsidies or preferential access to the market.
Agricultural trade flows can act as catalysts for the diffusion of AKST to exporting countries. Importers may invest in production and processing activities that employ technologies developed within their own countries to meet market needs. As markets are established imported technol- |
Table 3-12. Trade in agricultural products (2003) (1000$US).
Source: FAO, 2008c.