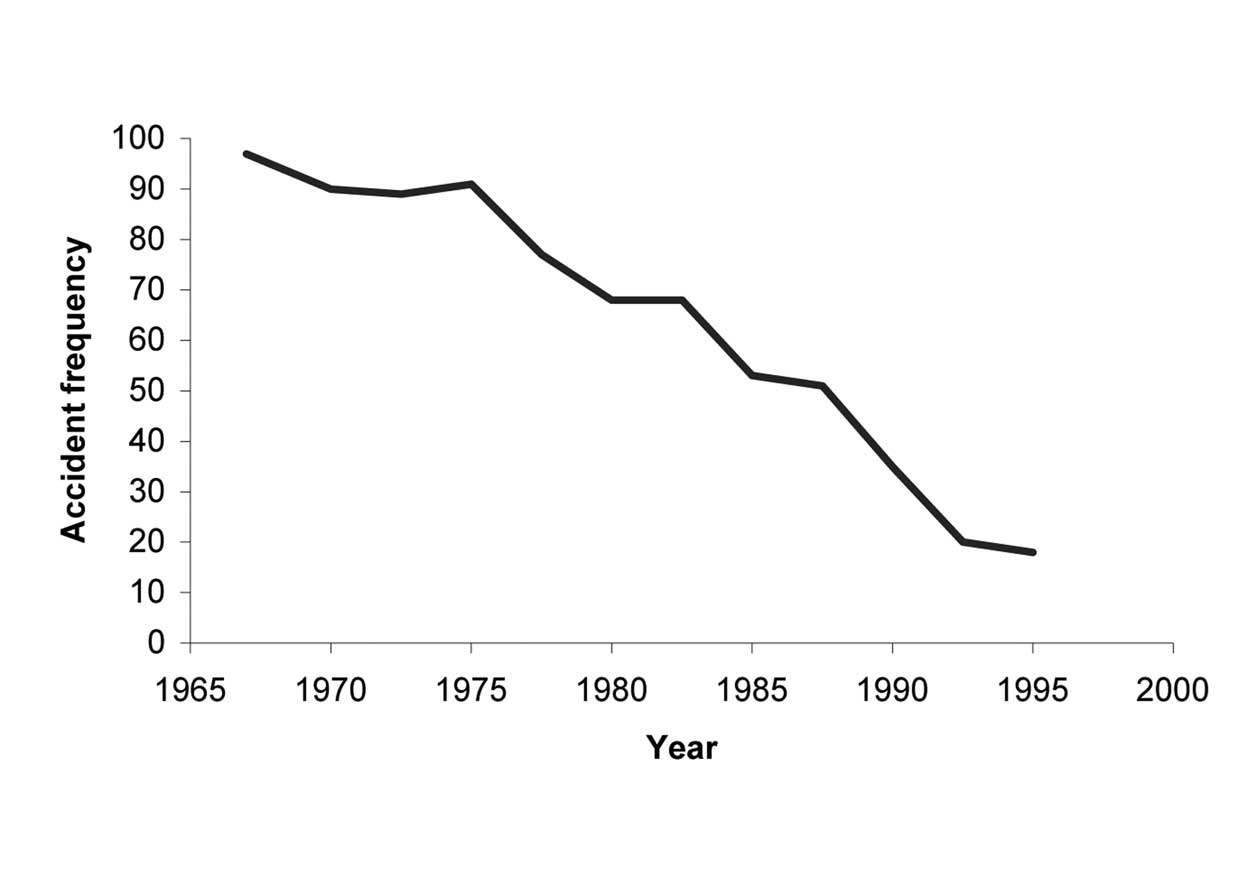
Figure 3-12. Accident frequency rate, i.e., number of accidents per one million hours worked in Swedish forestry (1967 to 1995). Source: Axelsson, 1998
jeopardizes the economic survival of some communities. In an area in which emotions often play an important part in determining attitudes there are a wide range of pressure groups who criticize many aspects of intensive livestock production (Compassion in World Farming, 2007).
Livestock kept in intensive systems are prone to outbreaks of disease which have been controlled by slaughter policy in some cases (e.g., foot and mouth disease) or more often through the use of antibiotics. However some production systems routinely utilize antibiotics both for disease prevention and growth promotion. This has raised serious concerns within some parts of the NAE because of the rise of antibiotic resistant bacteria in humans which some argue is linked to livestock production (Mellon, 2000).
3.3.3 Social impact of increased mechanization
In all sections of agriculture increases in mechanization have resulted in redundancy in the farm labor force but the increased productivity/efficiency has also left more time for other work and enhanced worker environment by eliminating repetitive, dangerous and disliked tasks (Culshaw and Stokes, 1995; Wilson and King, 2003). Its ability to secure lower costs implies growing pressures on small farms that cannot, or fail to, apply similar methods. Where communities depend on traditional agriculture, as in many areas of Europe, it is likely to increase pressure on farmers and farm workers to seek employment off the farm and accelerate the continuing decline of the farm labor force. The social and political consequences of this are likely to remain at the centre of agricultural policy thinking into the 21st Century.
In forestry one of the greatest impacts of the increase in mechanization has been on a reduction in accidents (Figure 3-12). Forestry is an innately dangerous operation and in Sweden between 1970 and 1990 the number of accidents decreased from 8656 to 1469. The accident risk, expressed as accident frequency rate, was reduced from 90 to 35 accidents per one million man-hours worked (Axelsson, 1998).
3.3.4 Migration from rural areas
In North America and western Europe today the population working in agriculture is only a small share of each country's overall population. In contrast, in some countries in eastern
Europe the proportion of the population in agriculture is still very significant (Table 3-8). The rural population is still declining in terms of percentage of the total population in most NAE countries (Table 3-9). The rural population is still declining in terms of percentage of the total population in most NAE countries.
While overall trends are similar, different regions in NAE have different conditions impacting these changes. The farm population in the United States has decreased as a percentage of the US total population, falling to 1 % in 2002 from 17% in 1945 and the rural population to 21 % in 2000 from 36% in 1950, respectively (Dimitri et al., 2005). The decade of the 1950s saw the largest exodus from farming (Lobao, 1990) while 600,000 farmers exited farming between 1979 and 1985 (Heffernan and Heffernan, 1986), the latter characterized as the "Farm Crisis" of the 1980s that particularly affected the economic base of rural communities in the Midwestern states. Still, while the portion of rural dwellers in the US dropped from 50% of the population in 1945 to about 21% in 2005, this does not signal an exodus from rural areas, as the actual rural population has held relatively constant over this time.
In western Europe, as technology advanced during the 50 years following the Second World War, the number of
Table 3-8. Employment by major economic sectors in 2003 in a selection of countries in the NAE (as a % of total employment).
| Agriculture | Industry | Services | |
| Austria | 14.2 | 24.7 | 70.3 |
| Canada | 2.7 | 20.9 | 76.4 |
| Czech Republic | 4.2 | 38.3 | 57.5 |
| Denmark | 3.2 | 21.7 | 75.1 |
| Estonia | 6.1 | 32.4 | 61.6 |
| Finland | 5.3 | 26.3 | 68.4 |
| France | 3.7 | 21.1 | 75.2 |
| Georgia | 54.9 | 6.1 | 39.0 |
| Germany | 2.3 | 27.0 | 70.7 |
| Greece | 14.5 | 23.9 | 60.8 |
| Hungary | 5.4 | 33.4 | 61.3 |
| Italy | 4.2 | 29.0 | 66.8 |
| Netherlands | 3.4 | 18.1 | 78.5 |
| Poland | 18.4 | 28.6 | 53.0 |
| Romania | 35.7 | 29.8 | 34.5 |
| Russia | 10.9 | 24.2 | 64.9 |
| Spain | 5.7 | 29.7 | 64.7 |
| Sweden | 2.5 | 23.6 | 73.9 |
| Turkey | 33.9 | 22.7 | 43.4 |
| Ukraine | 19.5 | 24.6 | 55.9 |
| United Kingdom | 0.9 | 18.3 | 80.8 |
| United States | 1.6 | 21.1 | 77.2 |
Source: UNECE, 2005.