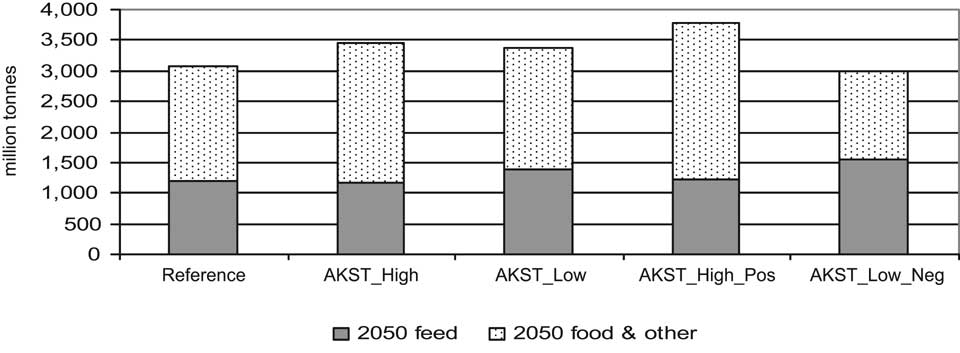
Figure 5-31. Cereal feed, food and other demand projections, 2050, alternative AKST variants. Source: IFPRI IMPACT model simulations.
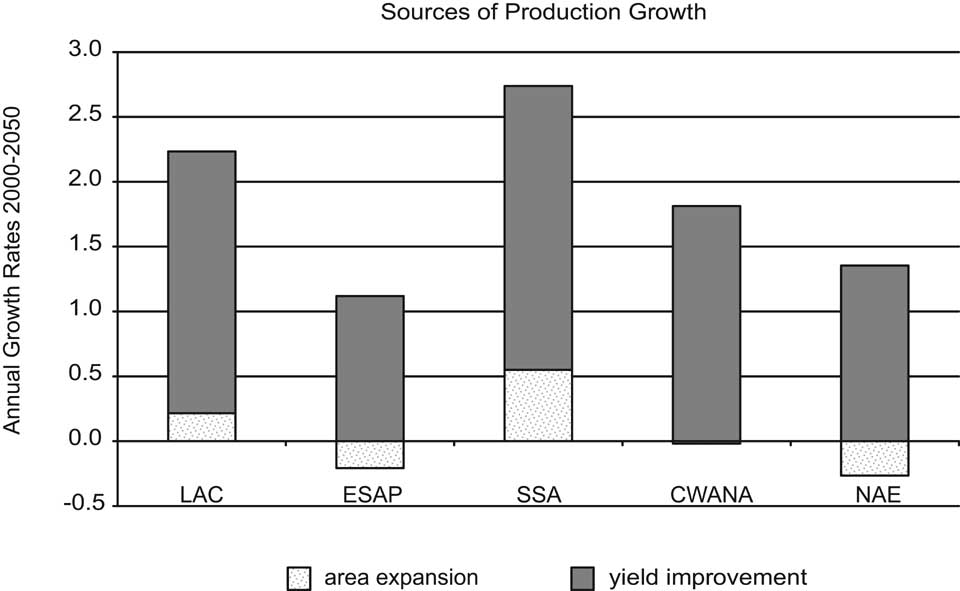
Figure 5-32. Sources of cereal production growth, High_AKST variant, by IAASTD region. Source: IFPRI IMPACT model simulations.
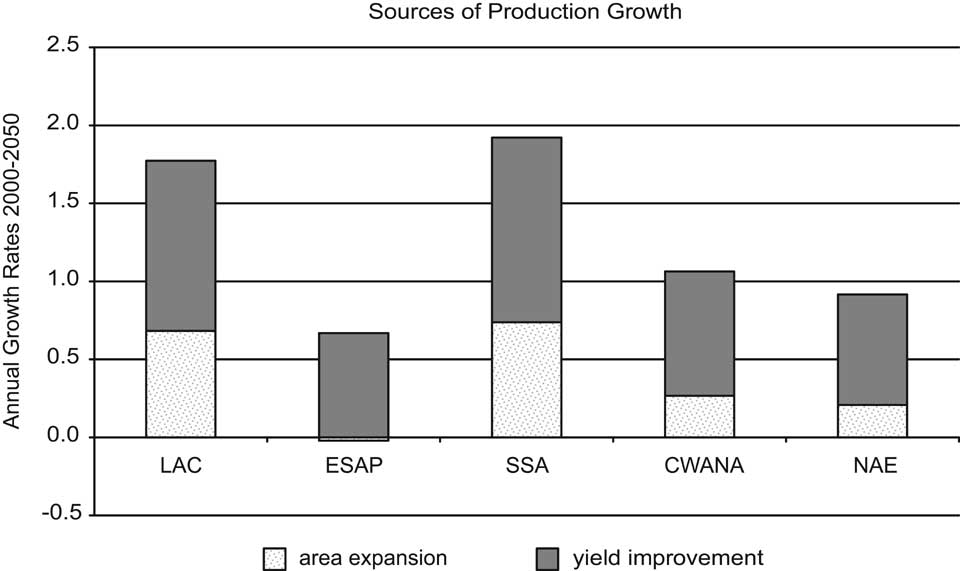
Figure 5-33. Sources of cereal production growth, Low_AKST variant, by IAASTD region. Source: IFPRI IMPACT model simulations.
and thus also below the levels of the base year 2000. Calorie availability together with changes in complementary service sectors can help explain changes in childhood malnutrition levels (see Rosegrant et al., 2002). Under the AKST_high and AKST_high_pos variants, the share of malnourished children in developing countries is expected to decline to 14% and 8%, respectively, from 18% in the reference world and 27% in 2000 (Figure 5-37). This translates into absolute declines of 25 million children and 55 million children,
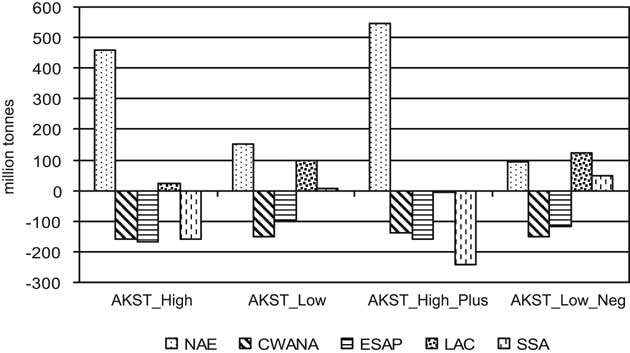
Figure 5-34. Cereal trade in 2050, alternative AKST variants, IAASTD regions. Source: IFPRI IMPACT model simulations.
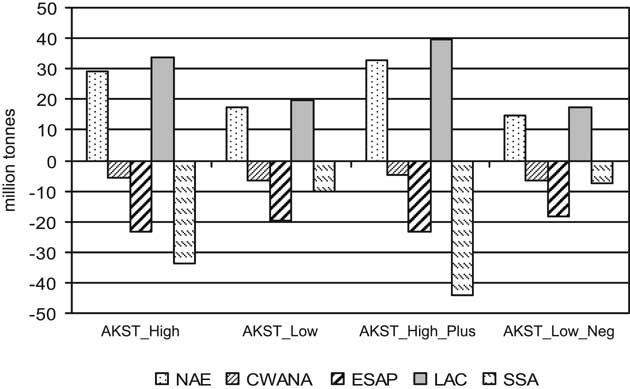
Figure 5-35. Meat trade 2050, alternative AKST variants, IAASTD regions. Source: IFPRI IMPACT model simulations.
respectively, under the more aggressive AKST and supporting service variations (Figure 5-38). On the other hand, if investments slow down more rapidly, and supporting services degrade rapidly then absolute childhood malnutrition levels could return or surpass 2000 malnutrition levels with 189 million children in 2050 under the AKST_low_neg variation and 126 million children under the AKST_low variation.
What are the implications for investment under these alternative policy variants? Investment needs for the group of developing countries for the alternative AKST variants have been calculated following the methodology described in Rosegrant et al. (2001) (Figure 5-39). Investment requirements for the reference run for key investment sectors, including public agricultural research, irrigation, rural roads, education and access to clean water are calculated at US$1,310 billion (see also Tables 5-16 and 5-17 for changes in parameters used). As the figure shows, the much better outcomes in developing-country food security achieved under the AKST_high and AKST_High_pos variants do not require large additional investments. Instead they can be achieved at estimated investment increases in the five key investment sectors of US$263 billion and US$636 billion, respectively.