quality constraints, which are becoming increasingly normal in regions where rivers and aquifers are contaminated by insufficiently treated or untreated industrial wastewater and nonpoint source pollution from agricultural practices. An increasing number of countries in ESAP are included in this category, for example, the Huai River Basin in China.
As a result of increased potential irrigation water consumption and reduction or moderate increase in actual irrigation consumption, irrigation water supply reliability (IWSR) is expected to decline in all regions. Globally, the IWSR decreases from 70% to 58% from 2000 to 2050. Regionally, LAC is likely to maintain a stable IWSR over the next 50 years given its abundance in water resources, although its water availability will decline by nearly 20% over this period. The IWSR of CWANA is expected to be below 50% by 2050 due to increased irrigation water demand (largely due to increased potential evapotranspiration) and reduced water availability. This would impose a significant impact on crop yield, and potentially jeopardize food security in this region.
Total harvested irrigated area is expected to increase from 433 million ha in 2000 to 478 million ha in 2025 and to then slightly decline to 473 million ha by 2050. Cereals account for more than half of all irrigated harvested area over the reference run period. Over the projections horizon, irrigated area is projected to more than double in SSA. However, by 2050, SSA is expected to still account for less than 2% of global harvested irrigated area. Increases in LAC and ESAP are projected at 41% and 12%, respectively, whereas almost no changes are projected for the CWANA and NAE regions (Figure 5-10).
Sharp increases in nonirrigation water demands are projected over the next 50 years, with increases concentrated in the group of developing countries (Table 5-15). In the reference run, globally, nonirrigation water consumption would almost double by 2050, approaching 651 km3 per year. Notably, nonirrigation consumption in developing countries is estimated to reach 482 km3, more than doubling from 2000. In comparison, total nonirrigation water consumption in developed countries only increases moderately. The most significant increase in the group of developing countries is domestic water consumption, which grows rapidly from 93 km3 to 256 km3 over 50 years. This dramatic increase is driven by both population growth and per capita demand increase due to income growth. Industrial demand would also increase significantly, with the largest relative increase in SSA (though still low by population size) and the largest absolute increase in ESAP.
5.3.3.3 Results for energy production and use
In terms of final energy demand, the reference projection shows an increase of 280 EJ in 2000 to around 500 EJ in 2030 and more than 700 EJ in 2050 (see also Figure 5-11). This is somewhat faster than the historic trend. This difference is the result of the fact that (1) historically several events have slowed down demand in energy consumption (energy crises, economic transition in FSU, Asia financial crisis), and (2) the increasing weight of developing countries with typically higher growth rates in the global total.
Most of the increase in energy demand takes place in the group of developing countries. At the same time, how-
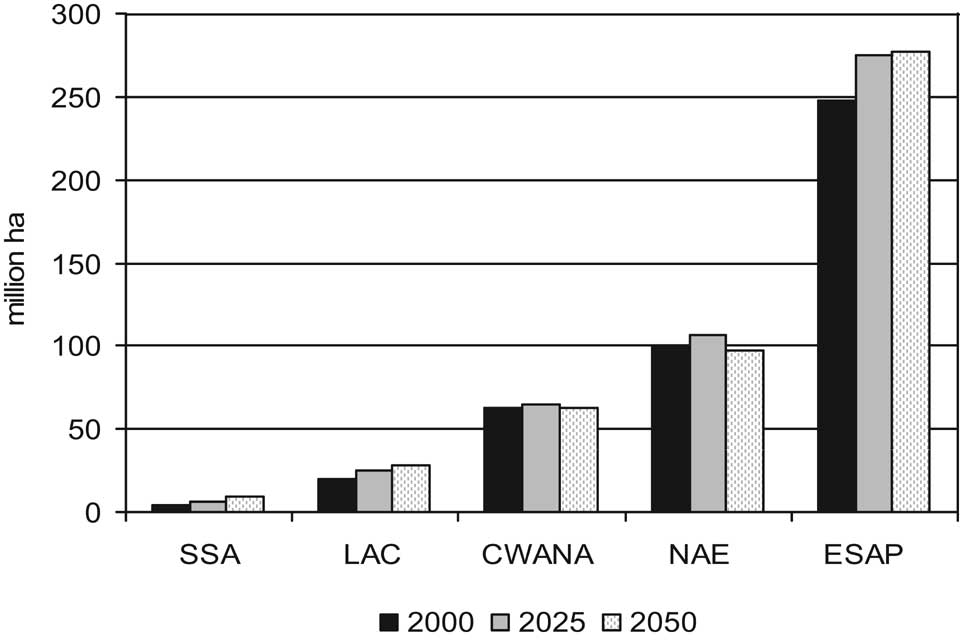
Figure 5-10. Changes in irrigated harvested area, 2000, and projected 2025, and 2050, reference run, by IAASTD region. Source: IFPRI IMPACT model simulations.
ever, it should be noted that per capita energy consumption remains much higher in developed countries than in developing countries. In terms of energy carriers, most of the energy consumption continues to be derived from fossil fuels—in particular oil (for transport). The growth of oil is somewhat slowed down in response to high oil prices. Modern bioenergy represents a fast growing alternative to oil— but remains small in terms of overall energy consumption. Coal use increases slightly—as high oil and gas prices imply that coal remains an attractive fuel in the industry sector. This partly offsets the trend away from coal in the buildings sector. Natural gas use increases at about the same rate as the overall growth in energy consumption. Finally, the level of electricity use increases dramatically.
In electric power, the reference run expects coal to continue to remain dominant as a primary input into power production. In fact, its share increases somewhat in response to high oil and gas prices—and as a result of high growth in electric power production in countries with high shares of coal and limited access to natural gas supplies (such as India and China). Rapidly growing alternative inputs such as solar/wind power and bioenergy gain market share, but form only about 10% of primary inputs by the end of the reference run period.
In terms of supply, it is expected that oil and natural gas production will concentrate more and more in a small number of producing countries as a result of the depletion of low-cost supply outside these countries. It is also expected that fossil fuel prices remain relatively high. In that context it should be noted that current high oil prices are mostly a result of (1) rapid increases in demand, (2) uncertainties in supply, and (3) underinvestment in production capacity. Some of these factors could continue to be important in the future—although estimates are hard to make (and strongly depend on perspectives of the future with respect to globalization and cooperation, regional tensions, etc.). In addition, depletion of low-cost resources will lead to upward pressure on prices. As a result, it is likely that fossil fuel prices remain at a relatively high level—although probably somewhat below 2005-2007 levels. Continued high price