| Previous | Return to table of contents | Search Reports | Next |
| « Back to weltagrarbericht.de | ||
280 | IAASTD Global Report
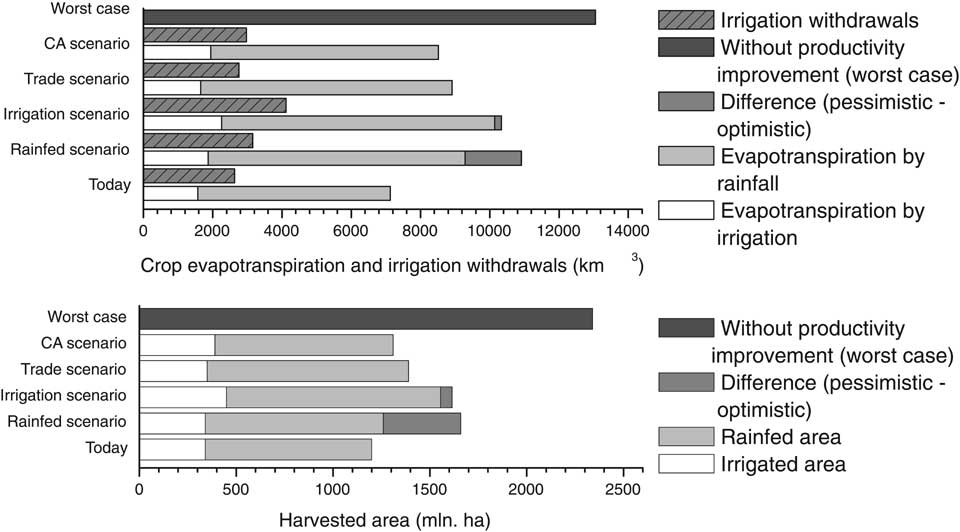
Figure 4-18. Land and water use today and in the future under different scenarios. Source: CA, 2007
Note: The dark gray bar represents the worst case scenario in which no productivity improvements occur in rainfed or irrigated agriculture. The 'rainfed scenario' assumes that most of future investments are targeted to upgrading rainfed agriculture. The medium-dark bar denotes the difference between optimistic and pessimistic yield assumptions and gives an indication of the risks involved in this scenario. The 'irrigation scenario' assumes a major drive in improvement of water productivity and expansion of irrigated areas. The 'trade scenario' assumes increased food trade from water abundant to water scarce areas. The 'Comprehensive Scenario' combines elements from all three scenarios depending on regional opportunities.
world has not been able to support its increasing population. The challenge is highly likely to persist towards 2050. |
|
of this area has been classified as low productivity. About half of the potentially arable land is actually cultivated, while remaining lands are under permanent pastures, forests and woodland (Scherr, 1999). In the future, feeding an increasing population will remain a challenge, particularly as per capita land availability decreases and soil degradation continues. |
Table 4-12. Comparison of recent global water use forecasts.
Author |
Projection period |
Increase in rain-fed cereal production |
Increase in irrigated yield |
Increase in irrigated harvested area |
Increase in cereal trade |
Increase in agricultural water withdrawals |
|
|
annual growth rate |
annual growth rate |
annual growth rate |
annual growth rate |
annual growth rate |
Shiklomanov 2000 |
1995-2025 |
|
|
0.74% |
|
0.68% |
Seckleret al. 2000 |
1995-2025 |
0.19% |
1.13% |
0.95% |
0.64% |
0.56% |
Rosegrant et al. 2002 |
1995-2025 |
1.14% |
1.14% |
0.36% |
2.41% |
|
Faures et al. 2002 |
1995-2030 |
1.10% |
1.00% |
0.95% |
2.08% |
0.43% |
Alcamo et al. 2005 |
2000-2050 |
|
|
0.06%-0.18% |
1.85%-2.44% |
0.40%-1.22% |
Fraiture et al. 2007 |
2000-2050 |
0.63%-1.03% |
0.58%-1.15% |
0%-0.56% |
0.98%-2.01% |
0.10%-0.90% |
Source: adapted from CA, 2007.
| Previous | Return to table of contents | Search Reports | Next |
| « Back to weltagrarbericht.de | ||