| Previous | Return to table of contents | Search Reports | Next |
| « Back to weltagrarbericht.de | ||
264 | IAASTD Global Report
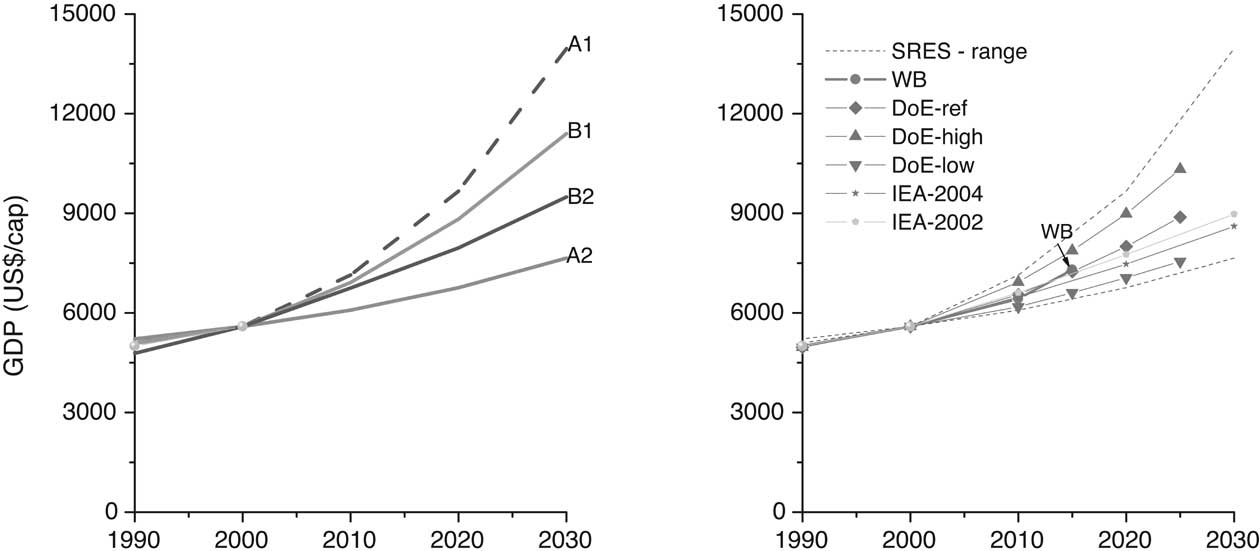
Figure 4-4. Comparison of global GDP growth in the SRES scenarios and more recent projections.
Source: see note.
Note: SRES = Nakicenovic et al., 2000 using Scenarios A1, B1, B2, and A2; WB = WorldBank, 2004b; DoE = US.DoE,
2004; IEA = IEA, 2002, 2004.
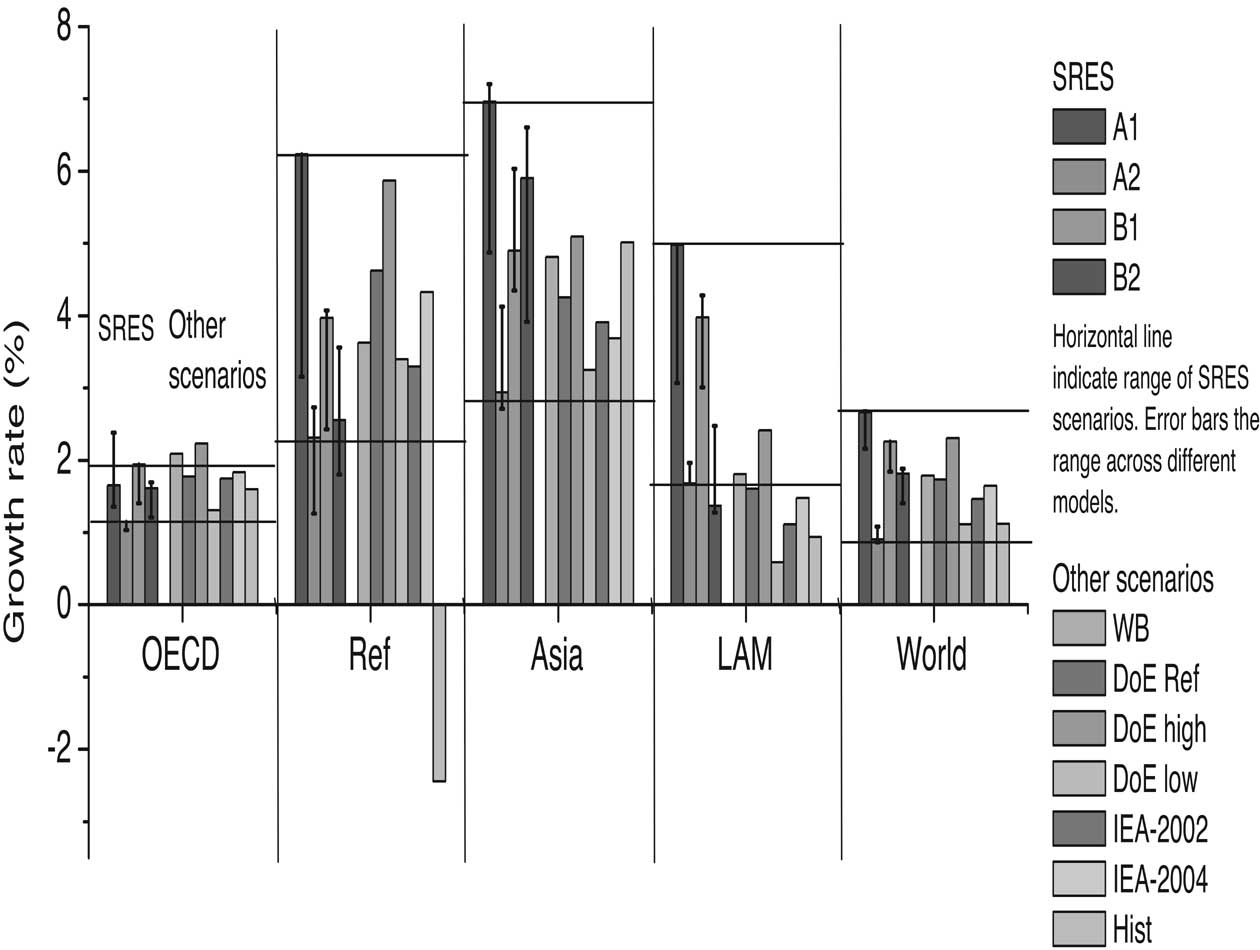
Figure 4-5. Comparison of regional GDP annual average growth rates between 2000-2015 in the
SRES scenarios and more recent studies. Source: See note.
Note: WB = World Bank, 2004b; DoE = USDoE, 2004; IEA = IEA, 2002, 2004. Hist = Historic data from World
Bank, 2003.
The horizontal lines in the figure indicate the range of growth rates set out by the SRES marker scenarios. The
vertical lines showing uncertainty bars for the SRES scenarios indicate the range of different outcomes of SRES
scenarios within the same family (while the bars indicate the growth rates of the Marker scenarios). The historical
rate represents the 1990-2000 period.
| Previous | Return to table of contents | Search Reports | Next |
| « Back to weltagrarbericht.de | ||