| Previous | Return to table of contents | Search Reports | Next |
| « Back to weltagrarbericht.de | ||
32 | IAASTD Global Report
|
risk of dying than those from richer households (WHO, 2003b). Hunger At the turn of the millennium, the world produced sufficient food calories to feed everyone, mainly because of increased efficiency brought about by the evolving plant science industry and innovative agricultural methods, including pesticides. The dietary energy supply for the global population was estimated to be 2803 kcal per person per day, comfortably within the range of average energy intake considered adequate for healthy living. Yet close to 800 million people were undernourished. Uneven distribution and consumption patterns across regions and among population groups, however, meant that the average actual food supply ranged from 3273 kcal per capita per diem in industrialized countries to 2677 in developing countries. Even these averages mask tremendous disparities. Dietary energy supply per capita per diem in Afghanistan, Burundi, the Democratic Republic of Congo and Eritrea was less than half that in Austria, Greece, Portugal and the United States (FAO, 2004a). While global production of food calories has outpaced population growth, thanks to improved farming methods and advances in plant and animal sciences, the number of people potentially supported by the world's food supply depends heavily on the kind of diet people consumed. There are vast regional differences in the prevalence of undernourishment (see Figure 1-15), which is increasing the vulnerability to hunger and famine. It has been calculated that the global food supply in 1993 was adequate to feed 112% of the world population on a near vegetarian diet, but only 74% of the population on a diet composed of 15% animal foods and just 56% of the population on a diet in which 25% of calories were derived from animal products (Uvin, 1995; DeRose et al., 1998). By the early 1990s, roughly 40% of the world's grain |
supply was consumed in animal feed, with grain-to-livestock ratios conservatively estimated at two kilos of grain to produce one kilo of chicken, four kilos for one kilo of pork and seven kilos for one kilo of beef (Messer and DeRose, 1998). Demand for meat is increasing in many parts of the world and feedlot livestock production will cause ever heavier demands on food resources as the proportion of industrially produced animal products increases. Almost 60% of the world's undernourished people live in South Asia, whereas the highest incidence of undernourishment is in sub-Saharan Africa, where approximately one-third of the population is underfed and hunger is on the increase (FAO, 2006a). In sub-Saharan Africa, food production per capita has not grown in the past three decades. Indeed, it declined during the 1970s and has remained stagnant ever since (FAO, 2006a). Poor households spend a proportionately larger share of their income on food than do wealthier households, and this budget share tends to decline as income rises. It is not unexpected, therefore, that per capita GDP is correlated with underweight of children under 5 (Haddad, 2000; see Figure 1-16). In low-income countries, average expenditure on food, beverages and tobacco represented 53% of household spending, compared to 35% in middle-income and 17% in high income countries. The budget share ranged from 73% of total household budget in Tanzania to less than 10% in the United States. The composition of the foodstuffs purchased varied according to income levels as well, with households in low-income countries spending significant portions (over one-third) of their budget on cereals, and fruit and vegetables, including roots and tubers, whereas meat, dairy and tobacco took up higher shares in high-income countries. Low value staple foods accounted for more than a quarter of consumers' total food budget in low-income countries, compared to less than one-eighth in wealthier countries |
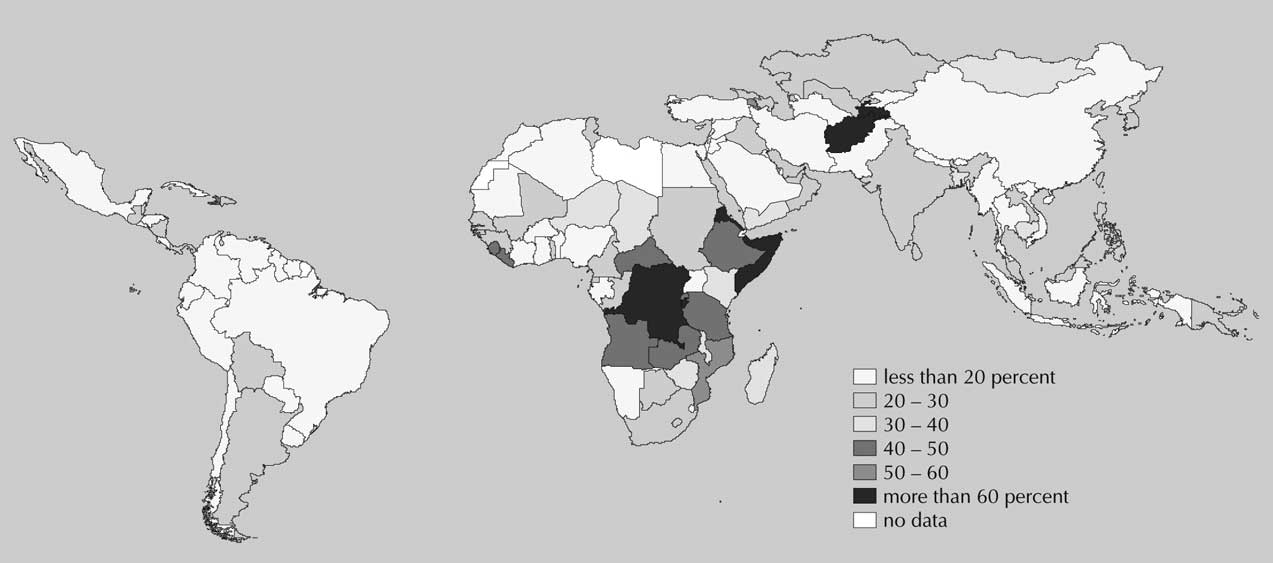
Figure 1-15. Proportion of the population unable to acquire sufficient calories to meet their daily caloric requirements, 2003 estimates. Source: Rosegrant et al., 2006.
| Previous | Return to table of contents | Search Reports | Next |
| « Back to weltagrarbericht.de | ||