similar to Japan's in 2000. In contrast, China used tractors moderately, which can be attributed to small-scale subsistence farming.
2.2.2.3 Fertilization
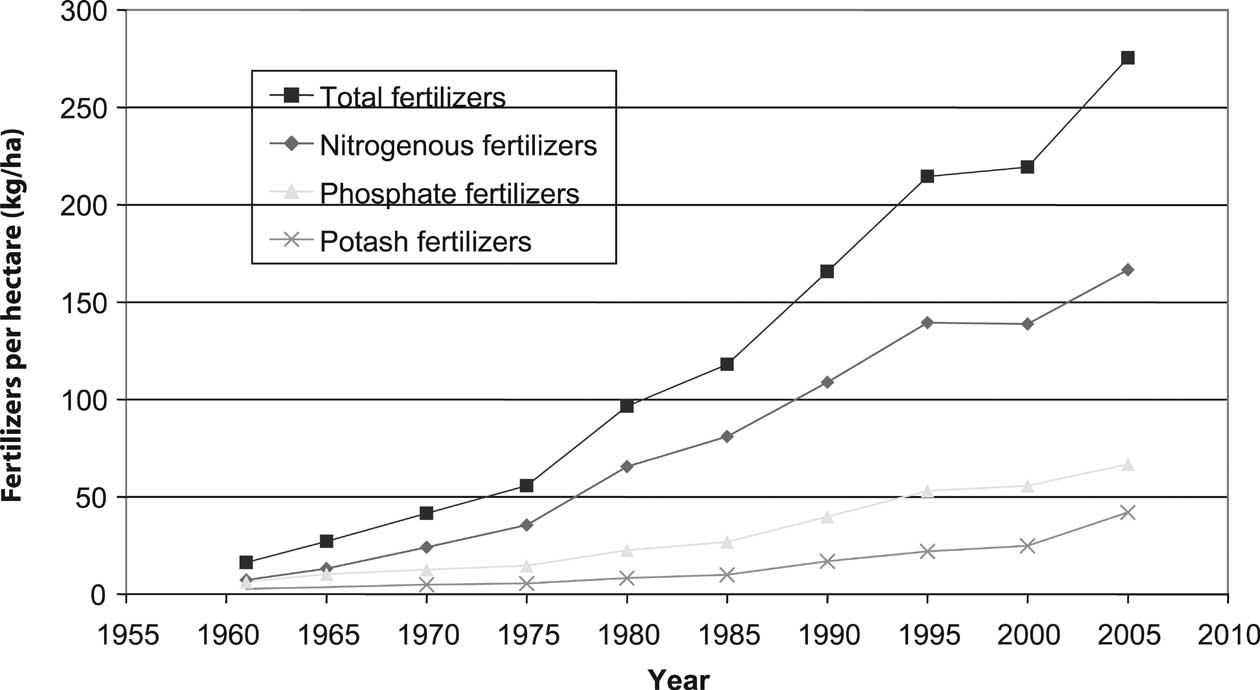
In ESAP, fertilizer use increased sharply and had reached 275 kg ha-1 by 2005 (Figure 2-3). The average annual growth rate was about 6.6%. About 61% of the fertilizers applied were nitrogen based; next was phosphorus (P) 24%, and potassium (K), 15%. Use of nitrogenous fertilizer increased 23-fold over this period.
Chemical fertilizer application varied significantly within ESAP. In East Asia, growth in usage was especially rapid, from 69 kg N ha-1 in 1978 to 155 kg N ha-1 in 2002. Growth was also rapid in Southeast Asia and South Southwest Asia, but much less than in East Asia. As a result, nitrogen use was much higher in East Asia than in Southeast Asia and South Southwest Asia. Over-reliance on this fertilizer led to nitrogen overdose in some high-yielding farmland in China. The adverse effects of excessive fertilizer use on the environment emerged as a serious concern (Zhu and Chen, 2002). Application of phosphate and potash fertilizer also grew rapidly, sometimes exceeding the growth in the use of nitrogen. On the other hand, many soil nutrients were mined, leaving many intensive rice systems exhibiting negative K balances (Dobermann et al., 2004). In some cases, reversing these imbalances would lead to higher profits for farmers.
2.2.2.4 Crop protection
Pesticide use in agriculture is on the rise in many developing countries in ESAP. Because data are often unavailable, it is difficult to paint a general picture of trends in ESAP or national pesticide use.
In China, the amount of pesticide used increased 1.8 times between 1991 and 2004. Pesticide use per hectare of sown area reached about 9 kg ha-1 in 2004 (Figure 2-4). Pesticide use was high in the wealthy and developed areas on the southeast coast, while poor areas, such as the north- |
|
west regions, used the least. Farmers growing grain in the North China Plain, who had used pesticides for many years, increased applications in response to pesticide resistance. Crops receiving the most applications were fruit, cotton, maize, and wheat. Pesticide use was high in greenhouses, where the chemicals were applied up to 10 times above the rate used in fields. Even in the field, it was not uncommon for farmers to double the recommended dose.
Importance needs to be placed on minimizing the negative health effects that pesticides, especially insecticides, have on farmers, who often spray with little or no protection. This can be done by educating farmers in integrated pest management (IPM) as promoted by FAO, through media campaigns and by strengthening regulatory enforcement. The perception of many farmers, extension service providers and even policy makers about the magnitude of crop losses caused by insect pests are often greatly exaggerated (Heong and Escalada, 1997) and probably contribute to pesticide overuse.
Plant breeding can also offer improved pest and disease resistance in new varieties. One example is the steady reduction in insecticide use on rice over the past 20 years in central Luzon, the rice bowl of the Philippines. Application rates are now lower than before the Green Revolution, but rice yields have increased. Another potential means of reducing insecticide use is Bt cotton, a genetically modified crop widely adopted in China and India, where collectively more than 70% of the region's cotton is produced. Reports indicate that insecticide use with Bt cotton has fallen dramatically and farmer health has improved (Pray et al., 2002).
2.2.3 Trend in crop production and application of AKST in major farming systems
2.2.3.1 Growth of crop production and increase in food availability
Over the past 50 years, food crop production has increased remarkably because of development in agricultural science, technology and modern inputs. The harvest area has |