| Previous | Return to table of contents | Search Reports | Next |
| « Back to weltagrarbericht.de | ||
Agricultural Change and Its Drivers: A Regional Outlook | 121
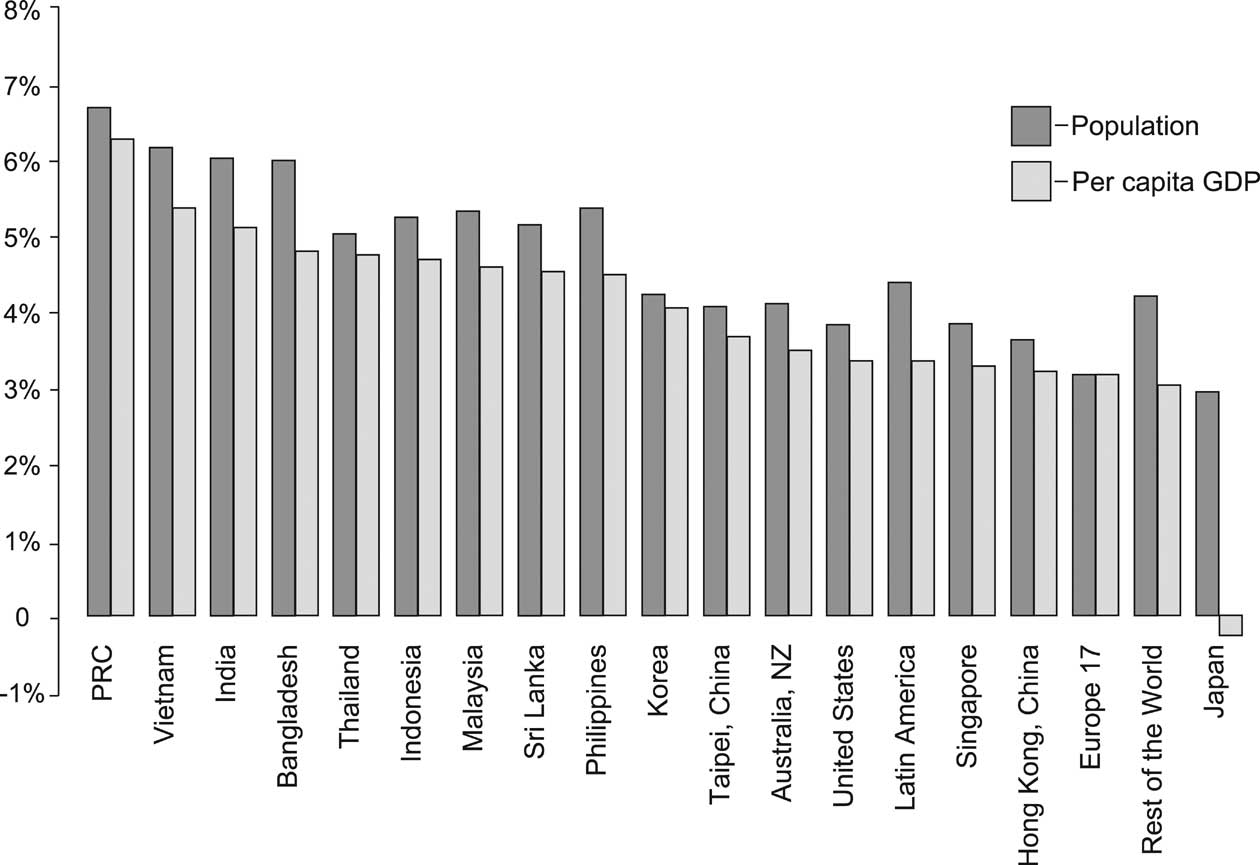
Figure 4-3. Baseline growth projections by Asian Development Bank. Source: Roland-Holst et al., 2005.
Table 4-2. Sources of productivity.
| 2005-2010 | 2010-2015 | 2015-2020 | 20152015 | |
| East Asia, excluding Japan | ||||
| GDP | 6.7 | 6.0 | 5.5 | 5.3 |
| Contribution Labor | 0.4 | 0.3 | -0.1 | -0.1 |
| of: Capital | 3.4 | 3.6 | 3.6 | 3.5 |
| TFP | 2.8 | 2.2 | 2.1 | 2.0 |
| Southeast Asia | ||||
| GDP | 6.9 | 6.8 | 6.1 | 5.5 |
| Contribution Labor | 1.0 | 0.8 | 0.6 | 0.4 |
| of: Capital | 1.8 | 2.1 | 2.4 | 2.6 |
| TFP | 4.4 | 4.2 | 3.4 | 3.0 |
| South Asia | ||||
| GDP | 7.0 | 6.1 | 5.7 | 5.3 |
| Contribution Labor | 1.0 | 0.9 | 0.8 | 0.7 |
| of: Capital | 2.2 | 2.2 | 2.2 | 2.2 |
| TFP | 3.8 | 3.0 | 2.6 | 2.4 |
| Developing Asia | ||||
| GDP | 6.8 | 6.2 | 5.6 | 5.3 |
| Contribution Labor | 0.6 | 0.5 | 0.2 | 0.1 |
| of: Capital | 2.9 | 3.2 | 3.2 | 3.2 |
| TFP | 3.2 | 2.7 | 2.4 | 2.2 |
Source: Roland-Holst et al., 2005.
| Previous | Return to table of contents | Search Reports | Next |
| « Back to weltagrarbericht.de | ||