| Previous | Return to table of contents | Search Reports | Next |
| « Back to weltagrarbericht.de | ||
278 | IAASTD Global Report
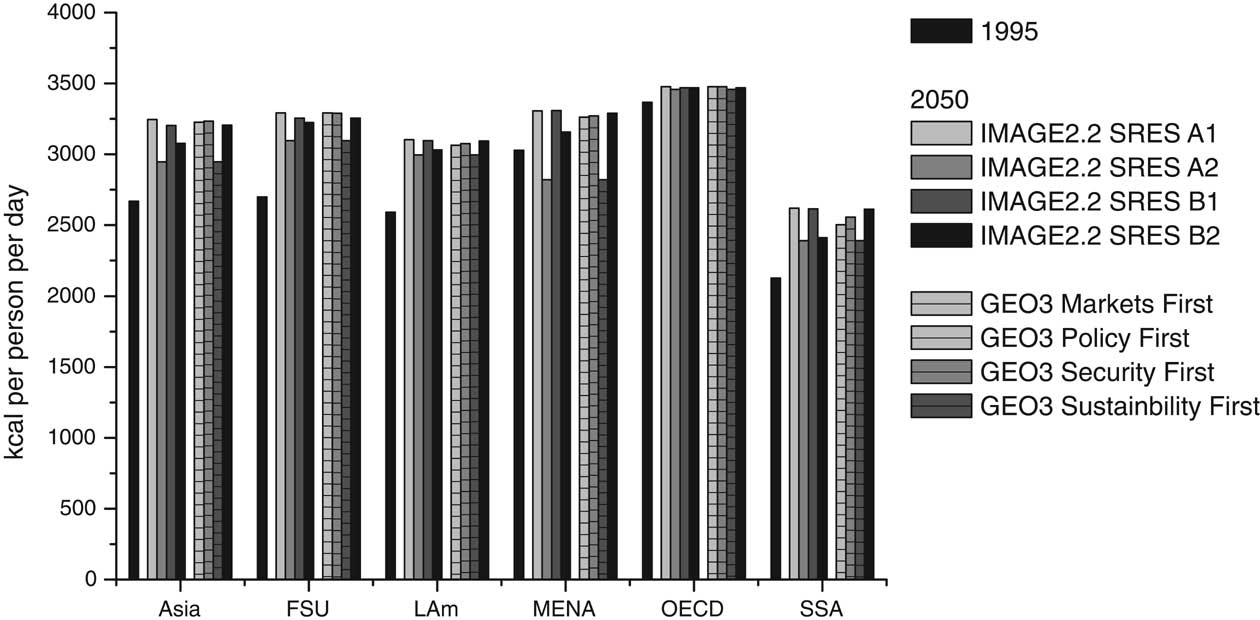
Figure 4-15. Kilocalorie availability per capita per day, 1995 and 2050. Source: Westhoek et al., 2005.
Notes: A1, A2, B1, and B2 are storylines used in IPCC assessments. These results are data underlying but not reported in the third IPCC Assessment Reports. In UNEP's assessment these data are not presented in the final GEO3 report.
|
person was available for human use. By 2000, that number had dropped to 7,800 m3 and it is expected to decline to 5,100 m3 per person by 2025, when the global population is projected to reach 8 billion. Already 1.2 billion people live in areas where water is physically scarce, and this number may double by 2050 (CA, 2007). The problem is becoming more urgent due to the growing share of food produced on irrigated land; the rapid increase of water use in industry and households; increasing water use for environmental and ecological purposes; and water quality deterioration (Rosegrant et al., 2002). |
|
The last 50 years saw great investments in large scale, surface irrigation infrastructure as part of a successful effort to rapidly increase world staple food production and ensure food self-sufficiency. During this period, in many countries more than half of the public agricultural budget and more than half of World Bank spending was devoted to irrigation (Faures et al., 2007). Spending on irrigation reached a peak of over US$1 billion per year in the late 1970s (in constant 1980 US dollars) but fell to less than half that level by the late 1980s (Rosegrant and Svendsen, 1993). The irrigated area roughly doubled from 140 million ha in the 1960s to |
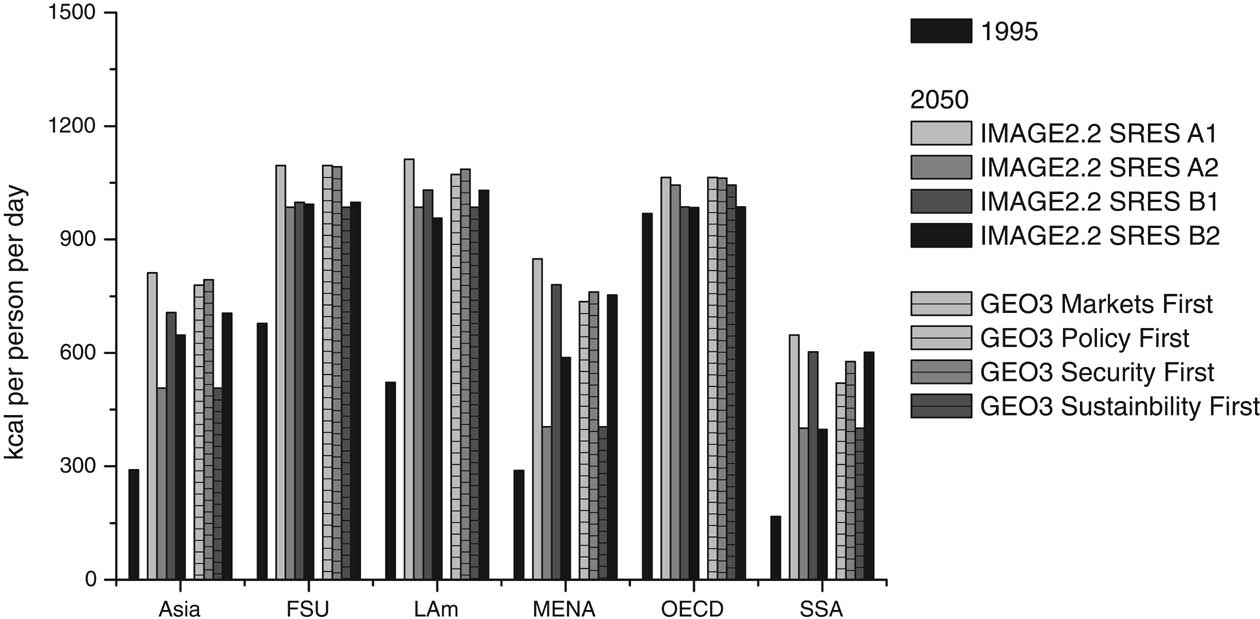
Figure 4-16. Kilocalorie availability per capita per day from livestock products only, 1995 and 2050. Source: Westhoek et al., 2005.
Notes: A1, A2, B1, and B2 are storylines used in IPCC assessments. These results are data underlying but not reported in the third IPCC Assessment Reports. In UNEP's assessment these data are not presented in the final GEO3 report.
| Previous | Return to table of contents | Search Reports | Next |
| « Back to weltagrarbericht.de | ||